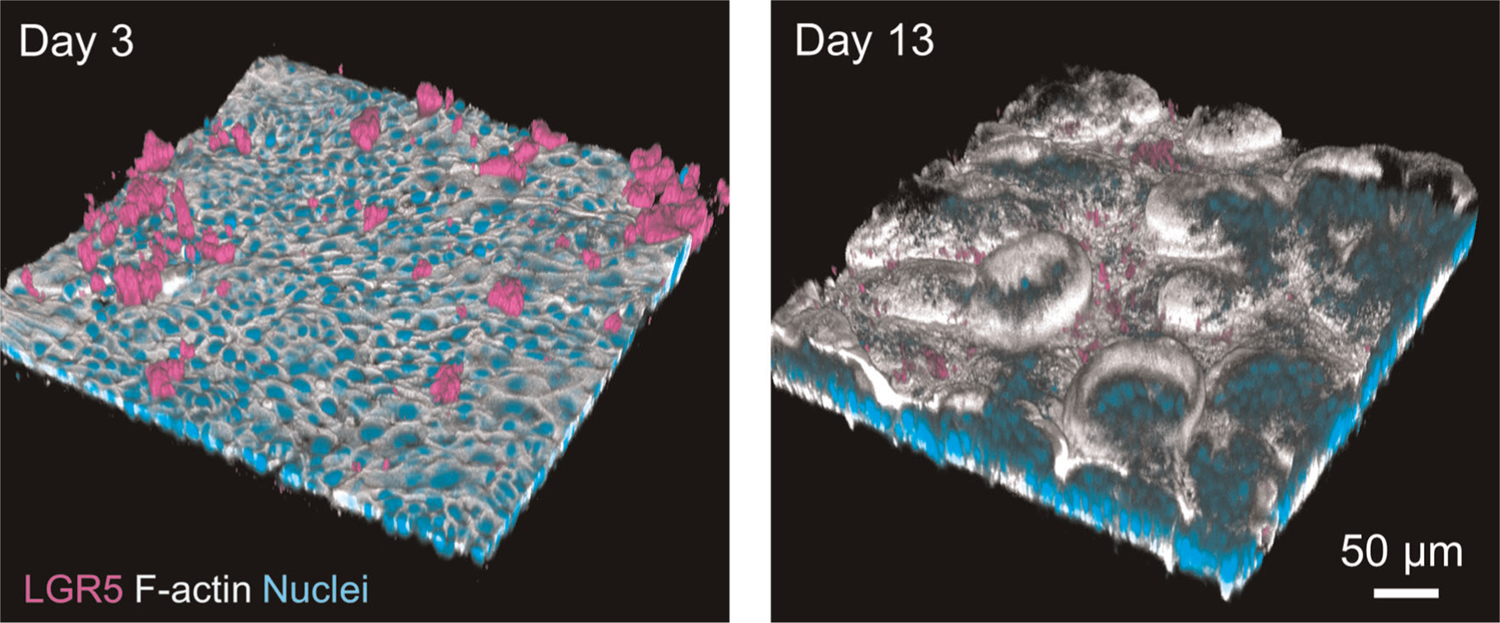
Extended Data Fig. 3 |. Expression of a stem cell marker LGR5.

The fluorescence image visualizes the expression of LGR5 on the organoid epithelium cultured in a gut-on-a-chip at days 3 and 13. Nuclei (cyan) and F-actin (gray) are also shown. This figure is comparable to Fig. 3f, where the co-localization of LGR5 with MUC2 was independently visualized by removing the MUC2 signal. Adapted with permission from ref. 12 under Creative Commons licence CC BY 4.0.
