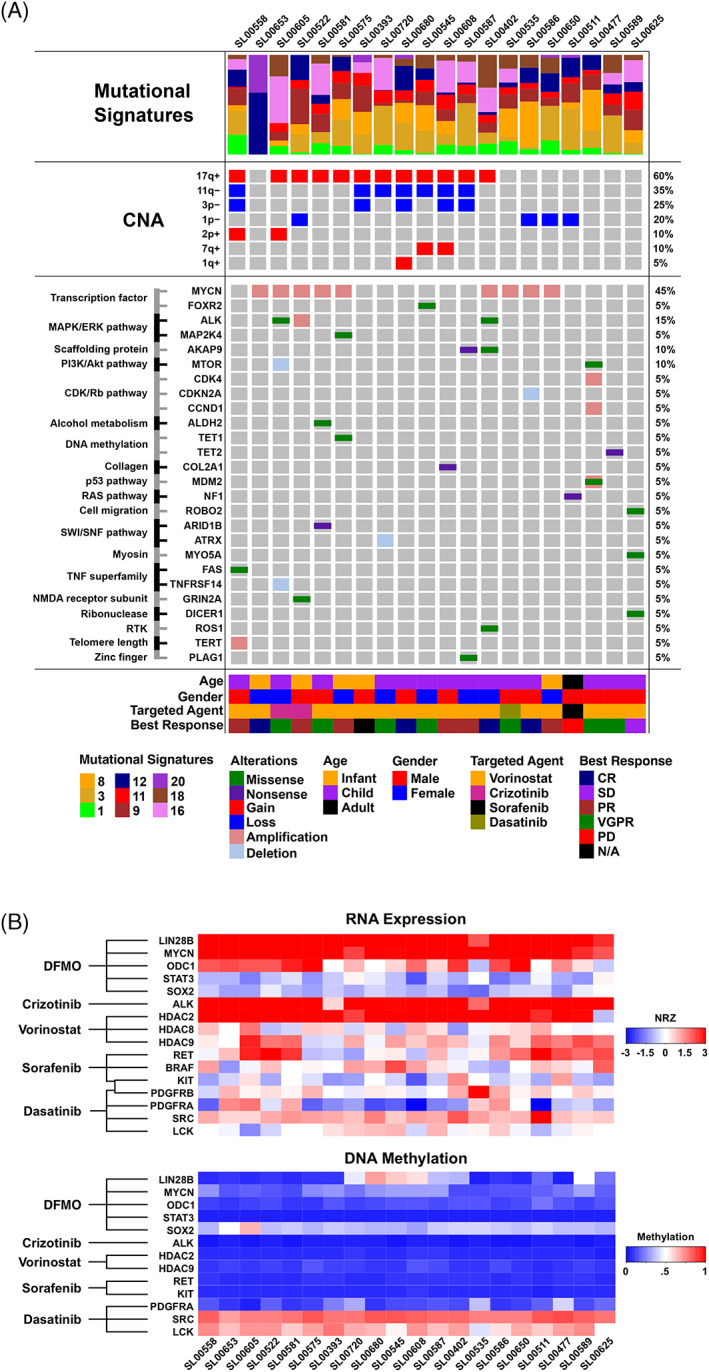
FIGURE 3.

(A) Oncoprint showing genomic, phenotypic, and clinical notes of interest. Genomic features from top to bottom include mutational signatures (Sanger COSMIC v2), recurrent large‐scale copy number alterations (CNA), and small‐scale genomic alterations including mutations with focal copy number alterations. Age, gender, targeted agent chosen at tumor board, and best response seen in the patient are also shown. (B) Heatmap showing RNA expression and DNA methylation of key drug target genes. Drug names are shown on the left with lines indicating which genes are targeted by each therapeutic. The top panel shows expression as an NRZ score (normal Z‐score) relative to a panel of 22 normal tissues. Darker red indicates overexpression (NRZ > 3), white indicates normal expression status (NRZ = 0), and darker blue indicates underexpression (NRZ < −3). The bottom panel shows methylation scores as beta values. Darker red indicates hypermethylation (beta>0.80), white indicates neutral methylation status at the loci (beta ~ 0.5), and darker blue indicates hypomethylation at the gene loci (beta < 0.20). BRAF and PDGFRB were omitted from the methylation heatmap as these genes did not contain methylation probes within the TSS200 region that passed the probe quality criteria. HƒDAC8 was also omitted as this gene had methylation probes within the promoter region, but farther upstream and not annotated within TSS200
