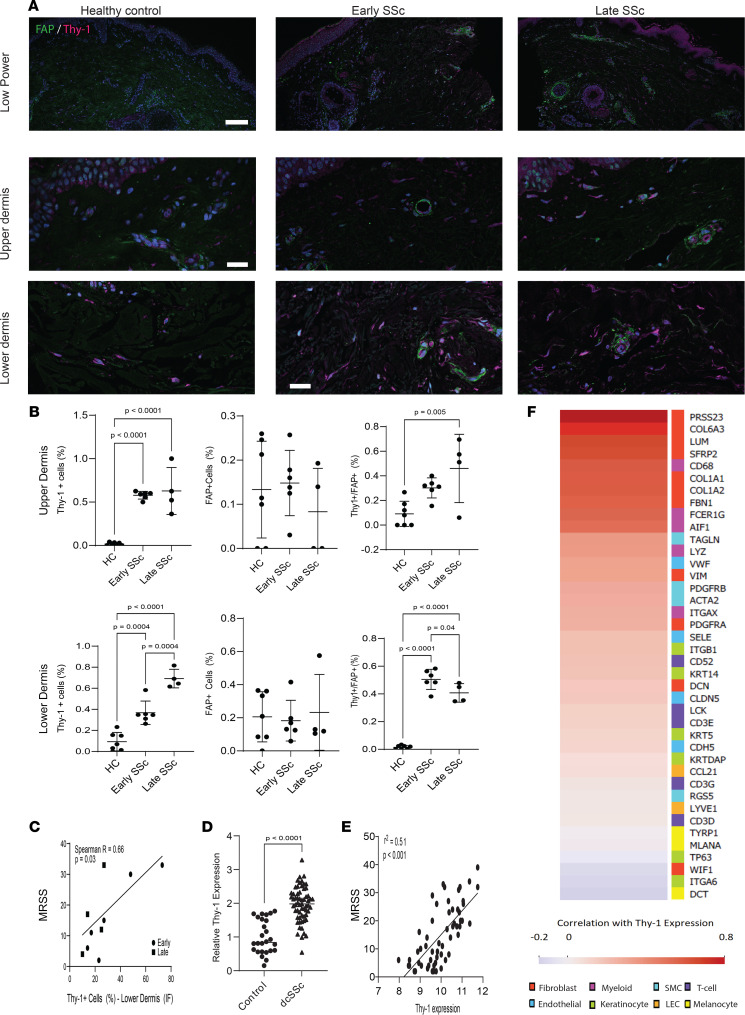
Figure 1. Increased Thy-1 expression in SSc skin biopsies.
(A) Immunofluorescence using Abs to Thy-1 (magenta) and FAP (green); nuclei stained with Hoechst (blue). Skin biopsies from patients with diffuse SSc with early (< 3-year duration, n = 7), late (> 3-year duration, n = 4) disease and age-matched healthy controls (n = 6). Representative photomicrographs. Scale bars: 250 μm (upper row), 100 μm (lower 2 rows). (B) Quantification of cells within the upper (top panel) and lower dermis (bottom panel) immunopositive for FAP (left), Thy-1 (middle) per total cells in 3 high-power fields per participant, and FAP+Thy-1+ cells per total Thy-1+ cells (right) in 3 high-power fields per participant. ANOVA with Tukey post hoc test. Bars represent means with SDs. (C) Correlation between Thy-1+ cells in the reticular dermis with the MRSS. (D) Thy-1 gene expression was assessed in a SSc skin biopsy transcriptome data set (GEO GSE58095). P values calculated using 2-sided t test. n = 64 SSc and 38 controls. Data are presented as means ± SDs. (E) Correlation between Thy-1 gene expression and MRSS. Spearman’s rank correlation test. n = 63. (F) Heatmap representing correlation between Thy-1 expression and expression of genes demonstrated to identify subpopulations of skin cells. Scale represents correlation (Spearman’s r) and genes are listed in order from highest to lowest correlation with colors on the right corresponding to cellular populations marked by each gene. SMC, smooth muscle cells; LEC, lymphatic endothelial cells.

