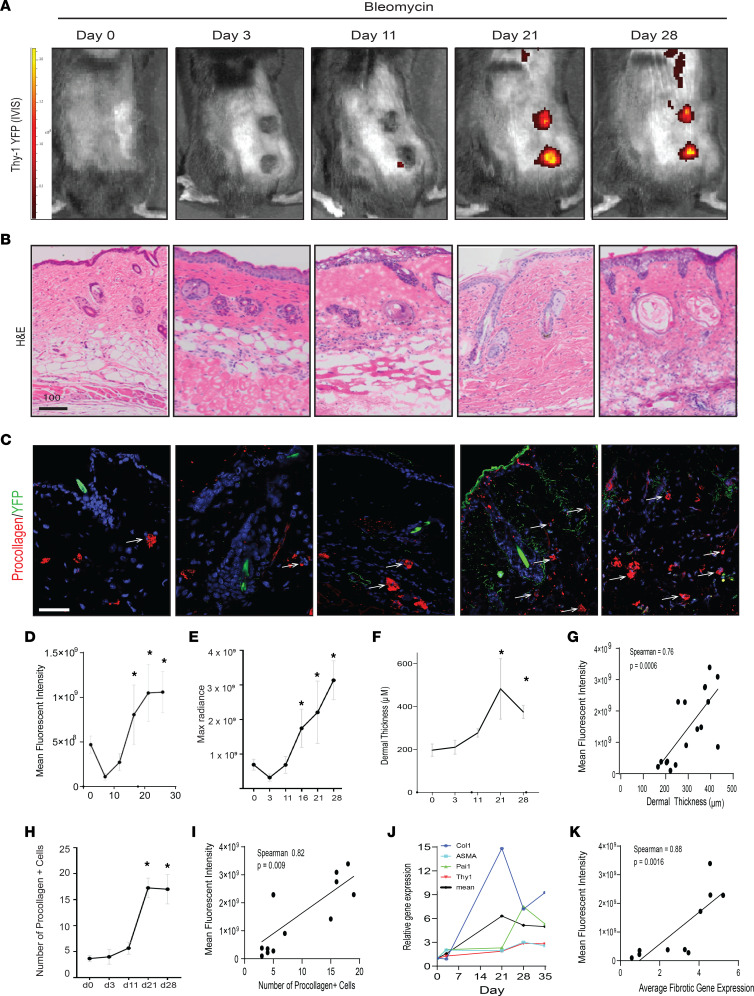
Figure 2. Thy-1 YFP can serve as an in vivo marker of skin fibrosis.
(A) Representative images of YFP signal (radiance efficiency [photon/s/cm2/sr]/[μW/cm2]) measured at λ excitation max, 465 nm, and λ emission max, 520 nm by IVIS Spectrum after bleomycin injection. (B) Representative H&E-stained skin images showing temporal increase in dermal thickness induced by bleomycin. Scale bar: 100 μm. (C) Representative immunofluorescence imaging for Abs against pro–collagen type 1 (red, white arrowheads) as well as endogenous YFP label (green). Scale bar: 100 μm. (D) Average and (E) maximal YFP fluorescence radiance measured over time (days). Data are shown as mean ± SD. Tukey’s multiple-comparison test. *P < 0.05 compared with day 0. n = 3 per group. (F) Quantification of dermal thickness over time (days) in bleomycin-treated mice, as determined by 5 high-power fields per mouse. Values are the mean ± SD. P values calculated using 2-sided t test. *P ≤ 0.05 versus day 0. n = 3–4 per group. (G) Correlation between dermal thickness and YFP maximal fluorescence intensity by IVIS. Spearman’s rank correlation. (H) Number of procollagen-immunopositive cells per high-power field. Results are mean ± SD from 3 high-power fields per mouse. P values calculated using 2-sided t test. *P ≤ 0.05. n = 3. (I) Correlation between number of pro–collagen 1+ cells and YFP maximal fluorescence intensity. Spearman’s rank correlation test. (J) Gene expression changes over time (PAI1, ASMA, COL1A1, and THY1) in skin treated with bleomycin analyzed by qPCR. The thicker black line represents the mean of all fibrotic genes. Data represent mean gene expression per time point. n = 3–4. (K) Correlation between the average of fibrotic gene expression and YFP maximal fluorescence intensity. Spearman’s rank correlation test. PAI1, plasminogen activator inhibitor-1; ASMA, α–smooth muscle actin (ACTA2).

