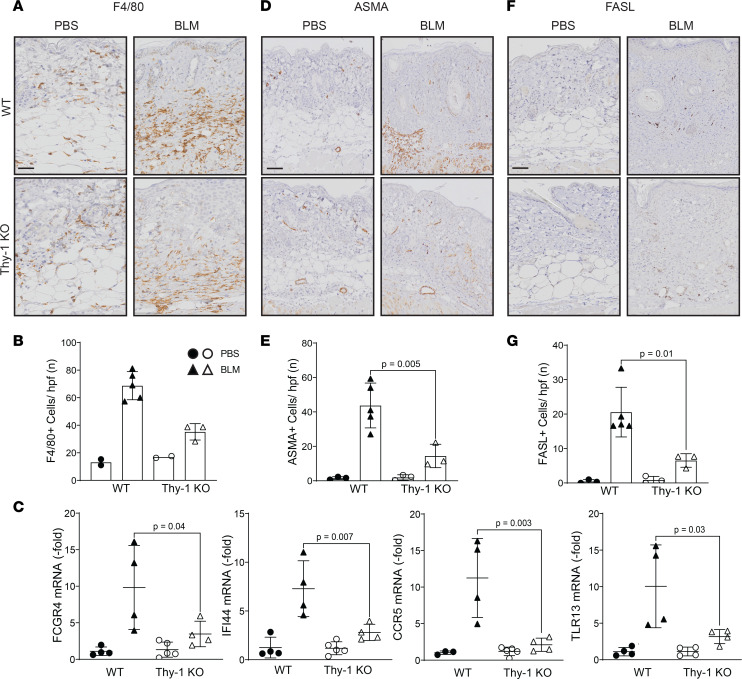
Figure 5. Thy-1–KO mice display decreased inflammation, number of myofibroblasts, and apoptosis during skin fibrosis.
Representative IHC stains against F4/80 (A), ASMA (D), and FASL (F). Scale bar: 50 μm. Quantitative analysis of positive cells for F4/80 (B), ASMA (E), and FASL (G). Values are the mean ± SD of 3 high-power fields per mouse. ANOVA with Tukey post hoc test in E. n = 2–5 mice/group; solid circles represent WT mice and open circles represent Thy-1–KO mice. (C) Expression of FCGR4, IFI44 CCR5, and TLR13 assessed by qPCR. Results were normalized to YWHAZ (n = 4–5 mice/group). Results are mean ± SD. ANOVA with Tukey post hoc test.

