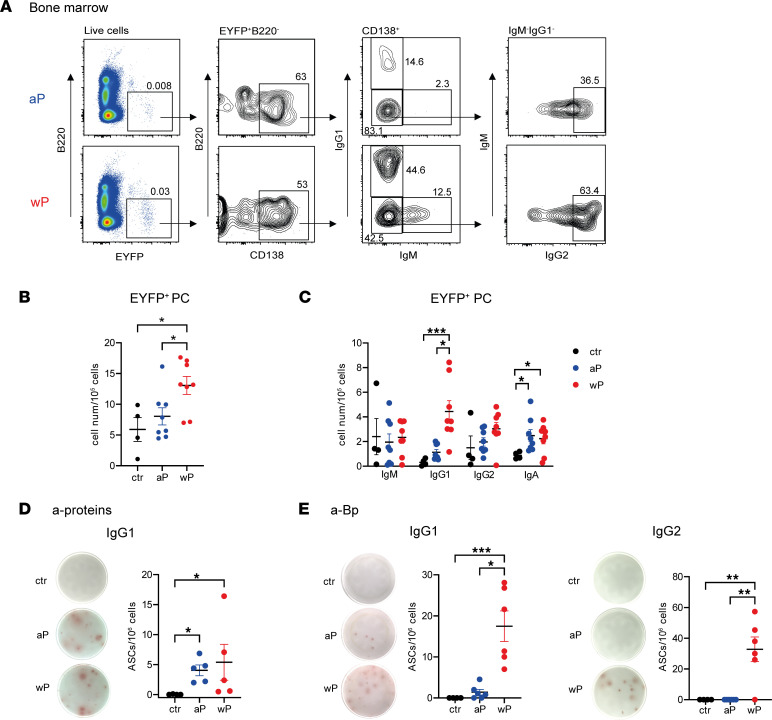
Figure 3. The wP prime induces a broader PC population in BM.
AID-Cre-EYFP mice primed with aP or wP vaccines or controls injected with alum (ctr) received 2 doses of tamoxifen at days 7 and 10 after prime vaccination. BM cells were collected 30 days after prime vaccination. (A) Representative flow cytometry profile of intracellular staining for EYFP+ PCs in BM. B220–EYFP+ live cells were gated into CD138+ cells before determination of IgM, IgG1, and IgG2 distribution among PCs (a similar independent analysis was performed for IgA at the place of IgG2, not shown here). Total EYFP+ PC cell numbers (B) or EYFP+ PC isotype distribution (C) are represented in the plots. Numbers of IgG1+ ASCs against pooled proteins (PT, PRN, FHA, Fim2,3) (D) and numbers of IgG1+ and IgG2+ ASCs against sonicated Bp (E) were determined by ELISPOT from total BM cells. Representative spot images for each condition are shown at the left of each panel. Each point in the graphs represents an individual mouse. At least 2 independent experiments were performed for each analysis. Means (±SEM) are shown. Kruskal-Wallis analysis with uncorrected Dunn’s test was performed to compare the different conditions. *P < 0.05, **P < 0.01, ***P < 0.001.

