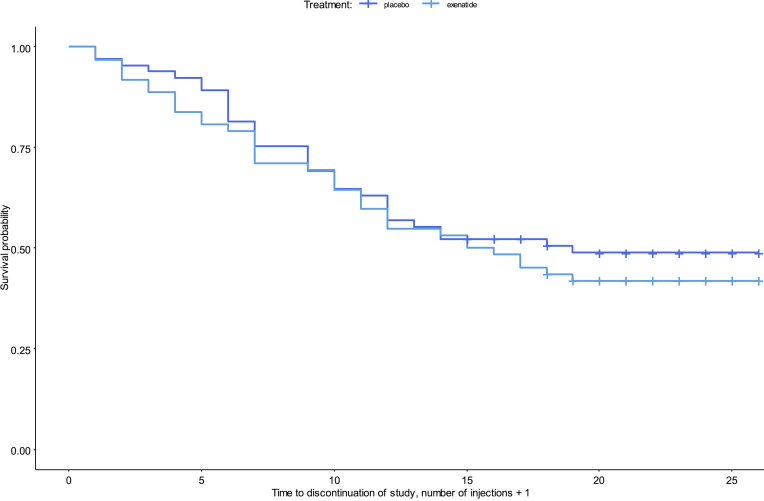
Figure 2. Kaplan-Meier survival curve of patients who withdrew from the trial or were lost to follow-up.
The time to discontinuation was not significantly different in the 2 groups (P = 0.46). Input data are the number of injections + 1 because patients were registered as discontinued in the week after the last injection was received. All patients are included (n = 127). Censoring is indicated by the + mark.

