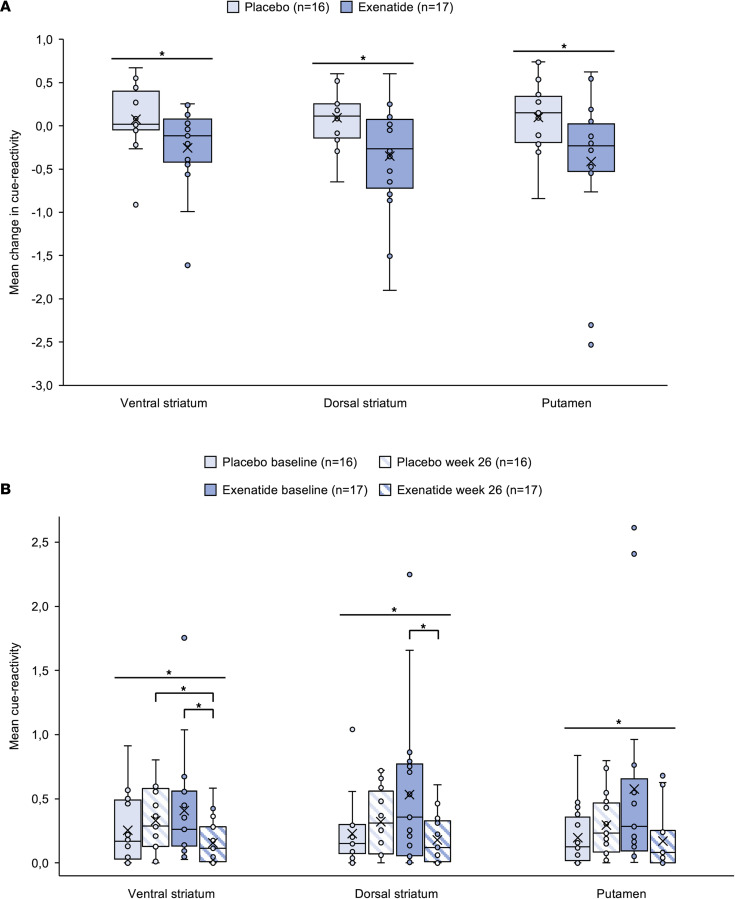
Figure 6. fMRI ALCUE ROI results.
(A) Key fMRI findings showed reduced cue reactivity after 26 weeks of treatment with exenatide compared with placebo. Analysis revealed statistically significant interaction between the treatment and time on fMRI response in all 3 ROIs: ventral striatum [F(1,31) = 4.744, P = 0.037, partial η2 =0.133], dorsal striatum [F(1,31) = 6.124, P = 0.019, partial η2 = 0.165], putamen [F(1,31) = 4.730, P = 0.037, partial η2 = 0.132]. *P < 0.05. (B) In more detail, we found that at week 26, cue-induced activity was significantly lower in ventral striatum after treatment with exenatide compared with placebo (M = –0.176, SE = 0.075, P = 0.025), but not in dorsal striatum (M = –0.142, SE = 0.076, P = 0.073) nor in putamen (M = –0.123, SE = 0.084, P = 0.153). At baseline, cue-induced activity did not differ significantly between groups. Within the exenatide group, cue-induced activity was significantly reduced from baseline to week 26 in ventral striatum (M = –0.254, SE = 0.116, P = 0.044) and in dorsal striatum (M = –0.351, SE = 0.156, P = 0.039), but not in putamen (M = –0.405, SE = 0.202, P = 0.063). Within the placebo group, no statistically significant differences were found. (A and B) ROI data were analyzed using a repeated-measures ANOVA including factors group and time and an independent sample 2-tailed t test comparing groups (placebo and exenatide). Placebo, n = 16; exenatide, n = 17. Boxes represent upper and lower quartiles, the line represents the median, and the X represents the mean. Horizontal lines indicate significant interactions between treatment and time (*P < 0.05), and brackets indicate significant simple effects (*P < 0.05).

