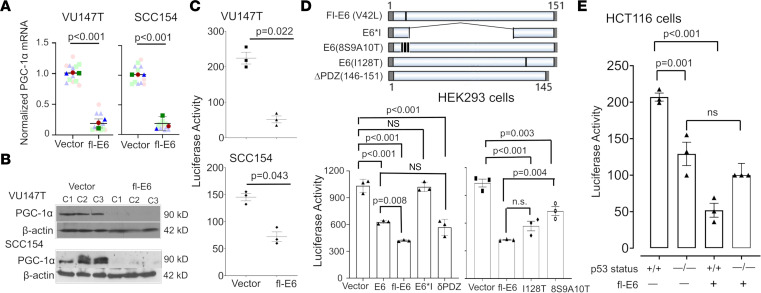
Figure 6. Fl-E6 represses PGC-1α levels by reducing p53-dependent PGC-1α promoter activity.
(A) qRT-PCR for PGC-1α normalized to 18S after lentiviral fl-E6 expression in HPV+ cancer cell lines. Super-plots represent mean ± SEM for 3 biologic replicates with 4 technical replicates. P values are from unpaired t tests. (B) Western blot for PGC-1α in 3 lentiviral fl-E6 transfected clones and 3 vector control clones. (C) PGC-1α promoter-driven luciferase reporter activity in HPV+ cancer cell lines in presence and absence of lentiviral fl-E6 expression. P values are based on paired t tests. (D) HEK293 cells cotransfected with the PGC-1α promoter-driven luciferase reporter plus the shown mutants of HPV 16 E6 (top) before measuring luciferase activity (bottom). (E) TP53-WT and -null HCT116 cells were cotransfected with the PGC-1α promoter-driven luciferase reporter plus fl-E6 or empty vector. Reporter activity is normalized using background from a vector control reporter and expressed as mean ± SEM for 3 technical replicates. All results are representative of at least 3 independent experiments. Adjusted P values were calculated using a 1-way ANOVA with Holm-Šidák multiple comparisons procedure.

