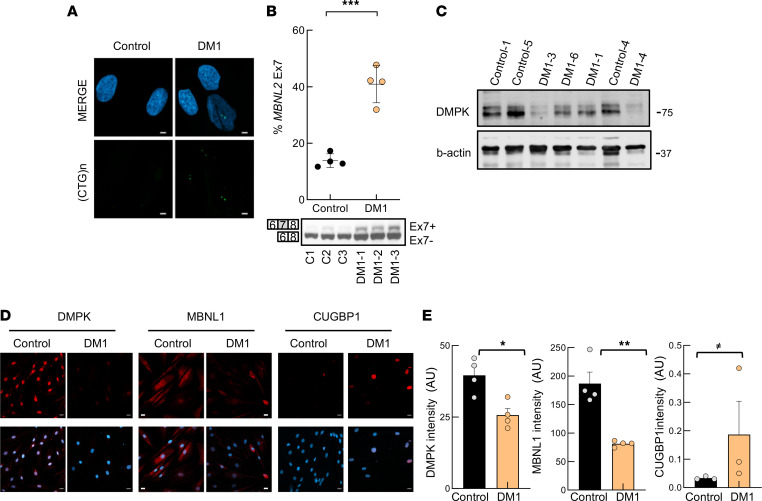
Figure 1. The molecular characteristics of DM1-derived fibroblasts resemble those of DM1 patient pathophysiology.
(A) Representative fluorescence of FISH images showing (CTG)n foci in DM1 and control fibroblasts (n = 4). Scale bar: 5 μm. (B) RT-PCR and representative immunoblot of alternative splicing changes of the MBNL2 transcript in DM1 and control fibroblasts (n = 4). Upper band represents the exon inclusion isoform (Ex7+) and lower band represents the exon exclusion isoform (Ex7–). (C) Representative immunoblot of DMPK protein levels in fibroblasts derived from patients with DM1 and controls stained with Santa Cruz antibody (sc-134319). (D and E) Representative images and quantification of DMPK, MBNL1, and CUGBP1 immunofluorescence in fibroblasts derived from patients with DM1 and controls (n = 3) Scale bar: 20 μm. Each point represents 1 independent fibroblast culture. P values were calculated using the Student’s t test. ≠P < 0.1, *P < 0.05, **P < 0.01, ***P < 0.001.

