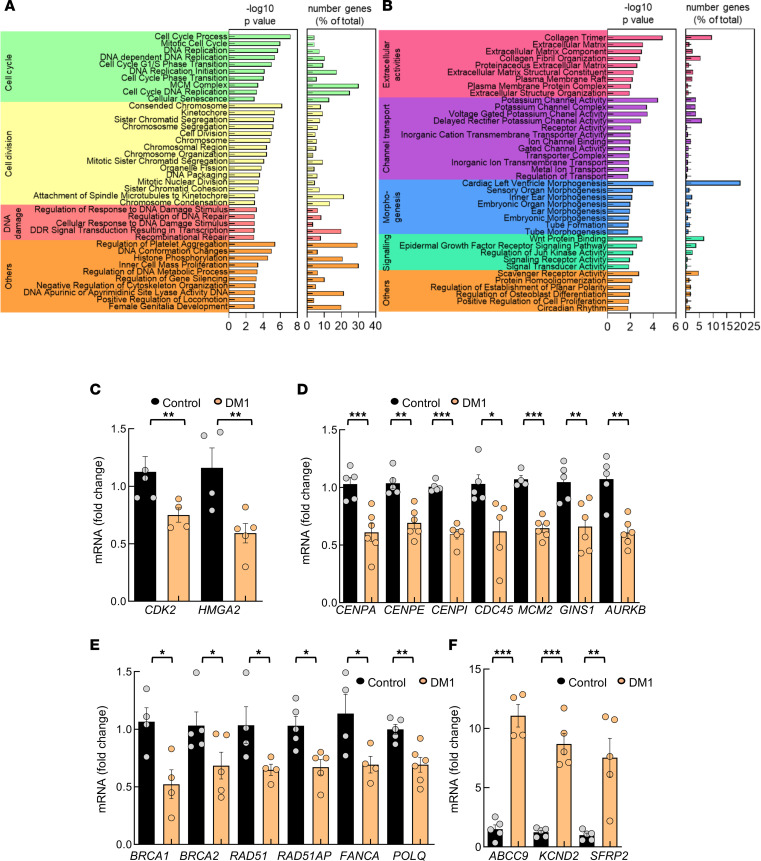
Figure 2. Transcriptomic studies reveal transcripts associated with multiple processes differentially expressed in DM1 fibroblasts.
(A and B) Bar plot of the –log10(P) and percentage of genes altered in each term of the significantly downregulated (A) and upregulated (B) terms in DM1 fibroblasts (n = 5) compared with controls (n = 3). Longer bars correspond to greater statistical significance of the enrichment. The significance of the gene set enrichment (P value) was calculated using the hypergeometric distribution. The multitest effect influence was corrected using the Benjamini-Hochberg correction test. (C–F) qPCR analysis of the indicated genes related to cell cycle (C), cell division (D), DNA damage repair (E), and extracellular matrix and potassium pathways (F) in DM1 and control fibroblasts (each point represents an independent sample). P values were calculated using the Student’s t test. *P < 0.05, **P < 0.01, ***P < 0.001.

