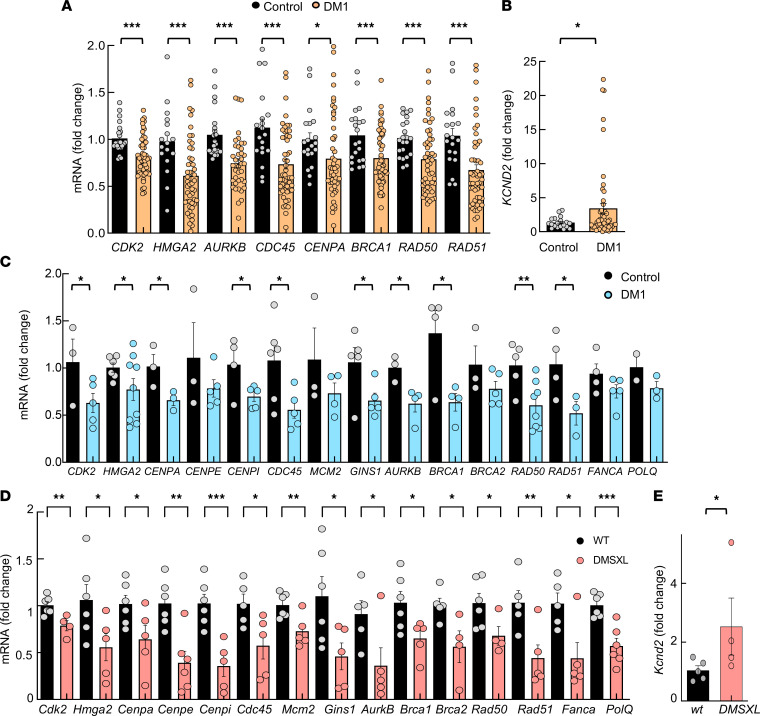
Figure 3. Transcriptomic findings are extended to additional DM1 models in vitro and in vivo.
(A) qPCR analysis of the indicated genes in PBMCs from DM1 and controls in PBMCs derived from patients with DM1 (n ≥ 56) and controls (n ≥ 22) (each point represents an independent sample). (B) qPCR analysis of KCND2 in PBMCs. (C) Measurement of mRNA levels of indicated genes by qPCR in early-passage myoblasts (n ≤ 7) derived from patients with DM1 and controls (each point represents an independent experiment). (D and E) Measurement of mRNA levels of indicated genes by qPCR in tibialis anterior muscle of 2-month-old DMSXL and control mice (n ≤ 6). P values were calculated using the Student’s t test. *P < 0.05, **P < 0.01, ***P < 0.001.

