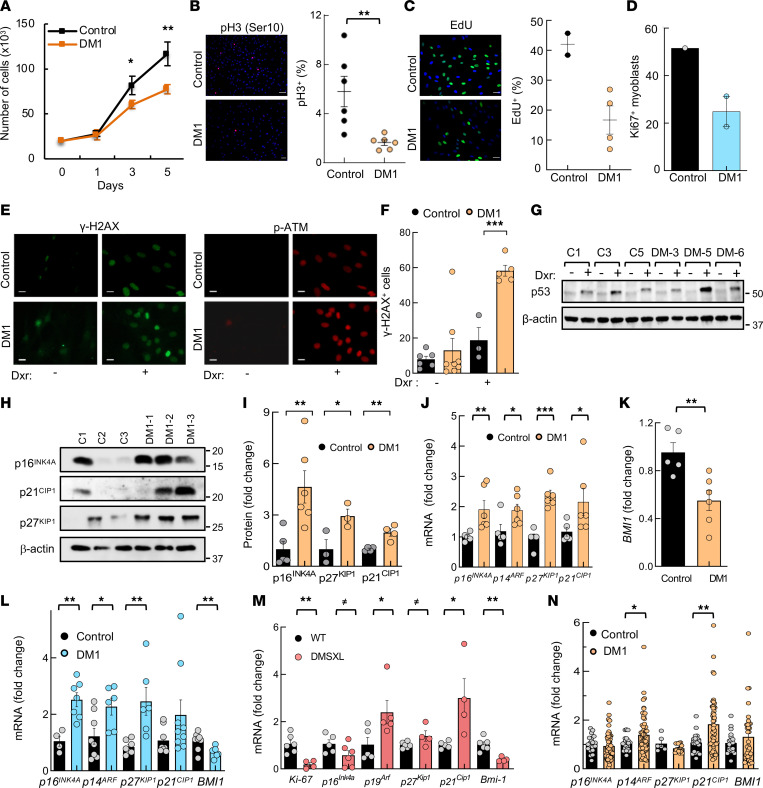
Figure 4. Proliferation and DNA damage response are impaired in DM1-derived fibroblasts.
(A) Growth of DM1-derived fibroblasts (n = 6) compared with control fibroblasts (n = 5), analyzed as the number of cells at day 1, 3, and 5. (B) Representative image and quantification of pH3+ (Ser10+) cells in controls (n = 6) and DM1 fibroblasts (n = 6). Scale bar: 100 μm. (C) Representative image and quantification of EdU+ cells in controls (n = 2) and DM1 fibroblasts (n = 4). Scale bar: 50 μm. (D) Quantification of Ki67+ cells in controls and DM1 myoblasts (n = 2) at early passage (n ≤ 5). (E) Representative image and quantification of γ-H2AX+ cells and phospho-ATM detection in controls and DM1 fibroblasts in the absence or presence of doxorubicin (n ≥ 3). Scale bar: 50 μm. (F) Quantification of γ-H2AX+ cells in indicated conditions. (G) Representative immunoblot of p53 detection in controls and DM1 fibroblasts in the absence or presence of doxorubicin (n = 3). (H and I) Representative immunoblot and quantification of p16INK4A, p21CIP1, and p27KIP1 protein levels in DM1 compared with control fibroblasts (each point represents an independent sample). (J) mRNA levels of p16INK4A, p14ARF, p27KIP1, and p21CIP1 in fibroblasts (n = 4 for controls and n = 6 for DM1). (K) mRNA levels of BMI1 in the same fibroblasts as J. (L) mRNA levels of indicated genes in early passage myoblasts (n ≤ 7) derived from patients with DM1 and controls (each point represents an independent experiment). (M) Measurement of mRNA levels of indicated genes in tibialis anterior muscle of 2-month-old DMSXL and control mice (n ≤ 6). (N) p16INK4A, p14ARF, p21CIP1, p27KIP1, and BMI1 mRNA levels in PBMCs from patients with DM1 (n ≥ 56) and controls (n ≥ 22). P values were calculated using the Student’s t test. ≠P < 0.1, *P < 0.05, **P < 0.01, ***P < 0.001.

