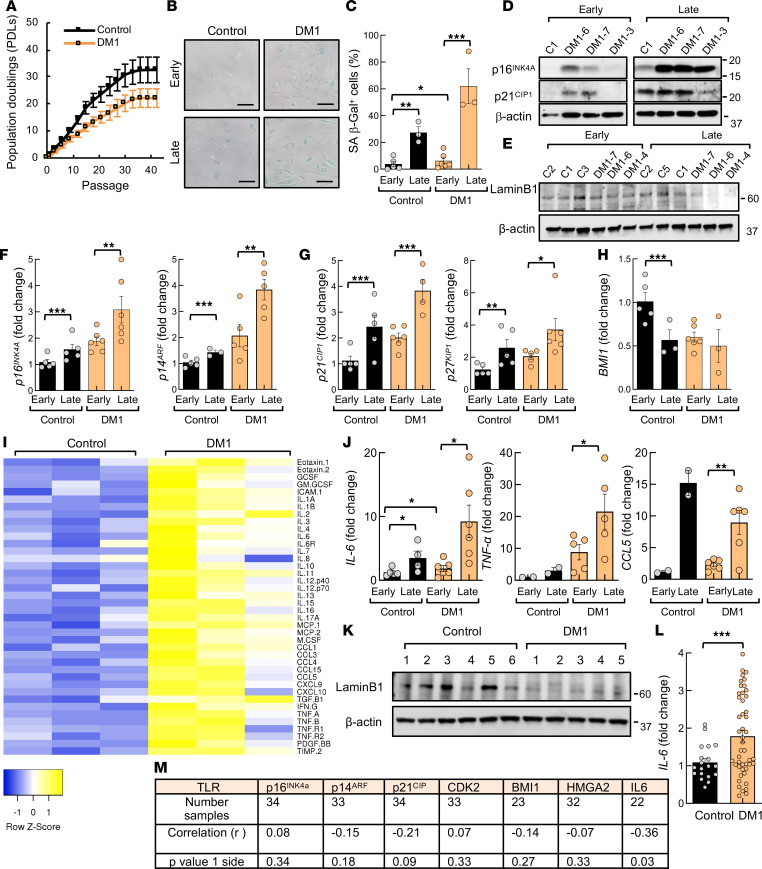
Figure 5. DM1 fibroblasts undergo premature senescence.
(A) Results of 3T3 protocol where replicative senescence was induced in fibroblasts by seeding at a density of 30 × 103 cells per 10 cm2 every 3 days. Population doubling (PDL) of DM1 cells (n ≥ 5) and controls (n = 4) was calculated at each passage. (B and C) Representative images and quantification of SA–β-galactosidase+ cells at early (between 3 and 10) and late passage (between 35 and 40) in control and DM1 fibroblasts (n ≥ 5). Scale bar: 100 μm. (D and E) Representative immunoblot of p16INK4A, p21CIP1, and Lamin B1 proteins at early (between 5 and 10) and late (between 35 and 40) passages in DM1 relative to control fibroblasts (n ≥ 4). (F–H) mRNA levels of p16INK4A, p14ARF, p21CIP1, p27KIP1, and BMI1 in DM1 and controls (n ≥ 4), at early and late passages. (I) Antibody array of soluble factors secreted by control and DM1 fibroblasts. For each cell culture, control signals were averaged and used as the baseline. Signals above baseline are shown in yellow; signals below baseline are shown in blue. The heatmap indicates fold changes from baseline between DM1 (n = 3) and control fibroblasts (n = 3). (J) IL6, TNFα, and CCL5 mRNA levels at early and late passages (n ≥ 4). (K) Representative immunoblot of Lamin B1 proteins in PBMCs from DM1 and controls (n ≥ 5). (L) Measurement of IL6 mRNA in PBMCs derived from patients with DM1 (n ≥ 56) and controls (n ≥ 22). (M) Pearson’s correlation analysis between expression of senescence markers and leukocyte telomere length in patients with DM1. Telomere length was measured in DNA samples extracted with Qiagen in a previous study (18). P values were calculated using the Student’s t test with P value corrected for FDR. *P < 0.05, **P < 0.01, ***P < 0.001.

