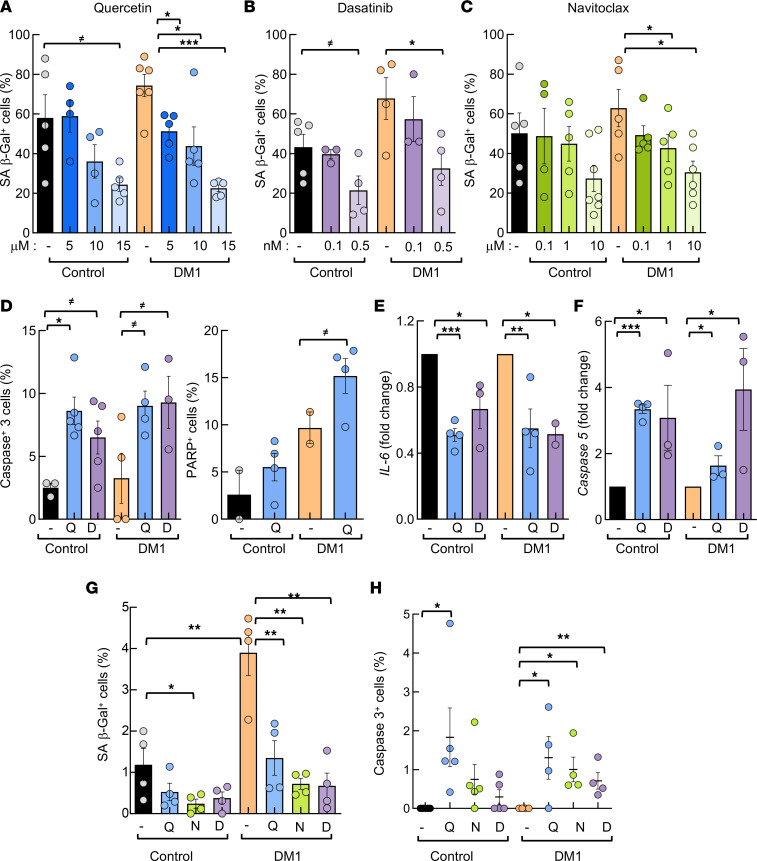
Figure 7. Senotherapy restores multiple deficiencies in DM1 fibroblasts in vitro.
(A–C) Quantification of SA–β-galactosidase+ cells, in absolute numbers, in late-passage (n ≥ 40) DM1 and control fibroblasts treated for 72 hours (n ≥ 6) with 5, 10, or 15 μM Quercetin, where 15 μM Quercetin treatment decreased the number of positive cells from 58% to 36% in controls and from 74 to 22% in DM1 (A); 0.1 or 0.5 nM Dasatinib, where 0.5 nM Dasatinib decreased them from 43% to 26% in controls and from 67 to 32% in DM1 (B); or 0.1, 1, or 10 μM Navitoclax, where 10 μM Navitoclax decreased them from 50% to 27% in controls and from 62 to 26% in DM1 (C). (D) Quantification of apoptosis measured as active caspase-3 and cleaved-PARP at late passage (n ≥ 40) after treatment with Quercetin or Dasatinib for 3 days (n = 3). (E and F) mRNA levels of IL6 and caspase-5 in late-passage fibroblasts treated with Quercetin or Dasatinib for 3 days. Each point represents an independent experiment (n = 3). (G) Quantification of SA–β-galactosidase+ cells, in absolute numbers, in early-passage (n ≥ 5) DM1 and control fibroblasts treated for 72 hours (n ≥ 5) with 15 μM Quercetin, 0.5 nM Dasatinib, or 10 μM Navitoclax. (H) Quantification of active caspase-3+ cells in early passage (n = 1-5) DM1 and control fibroblasts treated for 72 hours (n ≥ 4) with 15 μM Quercetin, 0.5 nM Dasatinib, or 10μ M Navitoclax. P values were calculated using the Student’s t test with P value corrected for FDR. ≠P < 0.1, *P < 0.05, **P < 0.01, ***P < 0.001.

