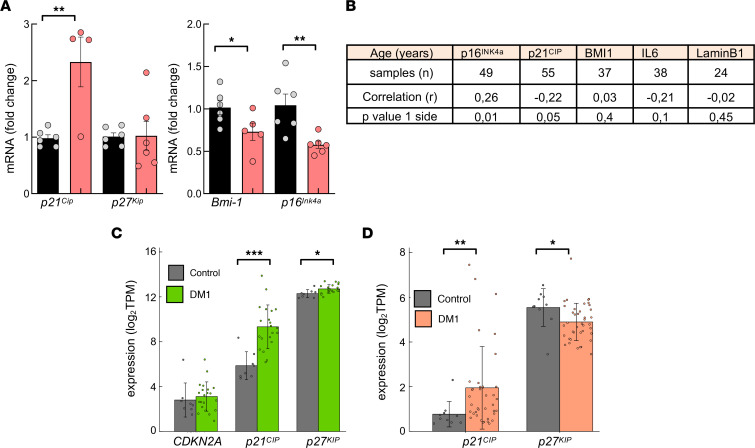
Figure 9. High levels of p21CIP in DM1 samples in vivo.
(A) Measurement of mRNA levels of indicated genes by qPCR in heart of 2-month-old DMSXL and control mice (n ≤ 6). Animals are the same as in Figure 4N. (B) Pearson’s correlation analysis between expression of senescence markers in PBMCs and age of patients with DM1. (C) Expression of indicated genes (in transcripts per million [TPM]) in cortex samples from patients with DM1 and downloaded from Gene Expression Omnibus (GEO; GSE157428). (D) Expression of indicated genes (in TPM) in cortex samples from patients with DM1 and downloaded from http://dmseq.org/data.html Statistical analysis was performed on log2-normalized expression, using 2-tailed Student’s t test for normally distributed gene expression data, tested with the Shapiro-Wilk test (P > 0.05). Otherwise, the Wilcoxon rank-sum test was used in genes (CDKN2A in C and p21CIP in D), where normality was rejected (P < 0.05).

