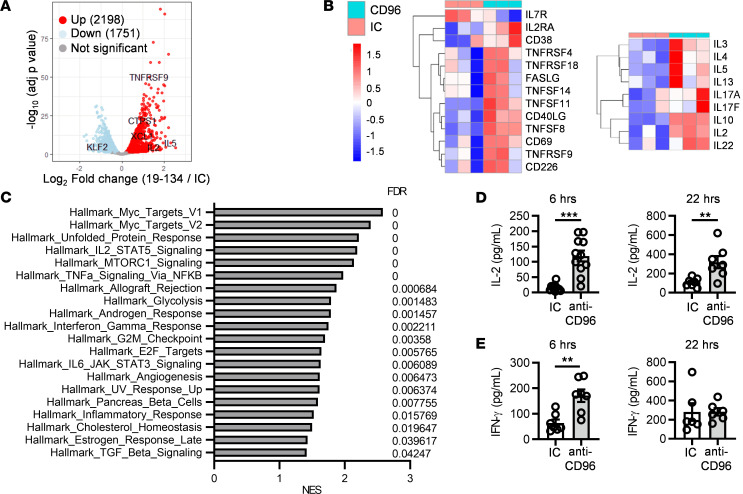
Figure 6. Anti-CD96 mAb triggers a transcriptional program associated with T cell proliferation and effector function.
Purified CD3+ T cells from 3 HDs were stimulated for 6 or 22 hours with plate-bound OKT3 and huG1 anti-CD96 mAb (clone 19-134) or an IC. (A–C) RNA-Seq analysis was performed after 6-hour stimulation; differential gene expression was determined with DESeq2 package. (A) Volcano plot representing differentially expressed genes. (B) Heatmaps plotted as regularized log-transformed expression values, illustrating differential gene expression of selected activation markers (left) and cytokines (right). (C) Gene set enrichment analysis showing hallmark gene sets significantly enriched in the anti-CD96 group versus the IC group. NES, normalized enrichment score. (D) IL-2 and (E) IFN-γ were quantified by ELISA in culture supernatants harvested after 6 and 22 hours. Data show the mean ± SEM, with each data point representing the mean of triplicate wells for an individual donor. Data are combined from (D) n = 6 and n = 4 independent experiments for 6 and 22 hours, respectively, and (E) from n = 4 independent experiments. **P ≤ 0.01, *** P ≤ 0.001. Two-tailed paired Student’s t test.

