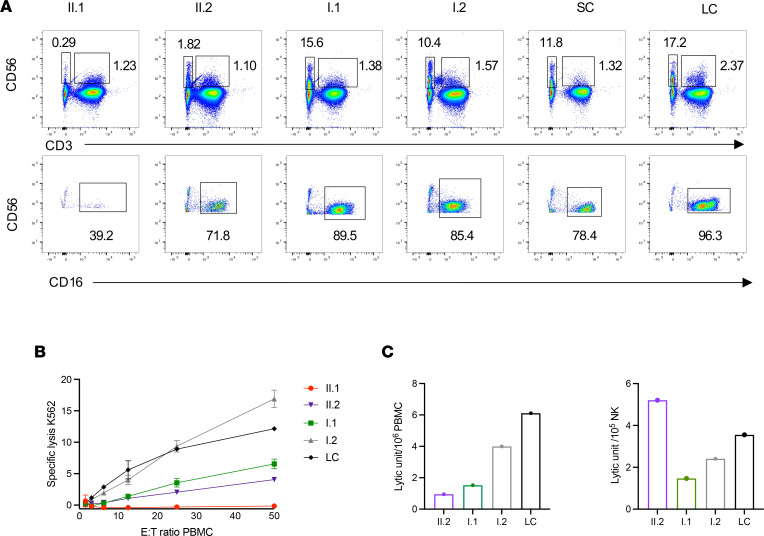
Figure 1. Frequency and cytotoxic function of peripheral NK cells.
(A) Flow cytometric analysis of CD56+CD3− NK cells and CD56+CD3+ NKT (top) and frequency of CD16+ NK cells (bottom). Two healthy donors, siblings (II.1, II.2), and their parents (I.1, I.2) are shown. Data are from a representative experiment of 3 independent repeats summarized in Table 2. LC, laboratory control; SC, shipping control. (B) 51Cr release assay to evaluate the cytotoxic function against K562 is shown for siblings, healthy parents, and LC. Data are shown as mean ± SD of technical replicates. Data are from a representative experiment of 2 independent repeats. (C) Graph of the lytic units calculated from the values of the 51Cr release assay shown in B.

