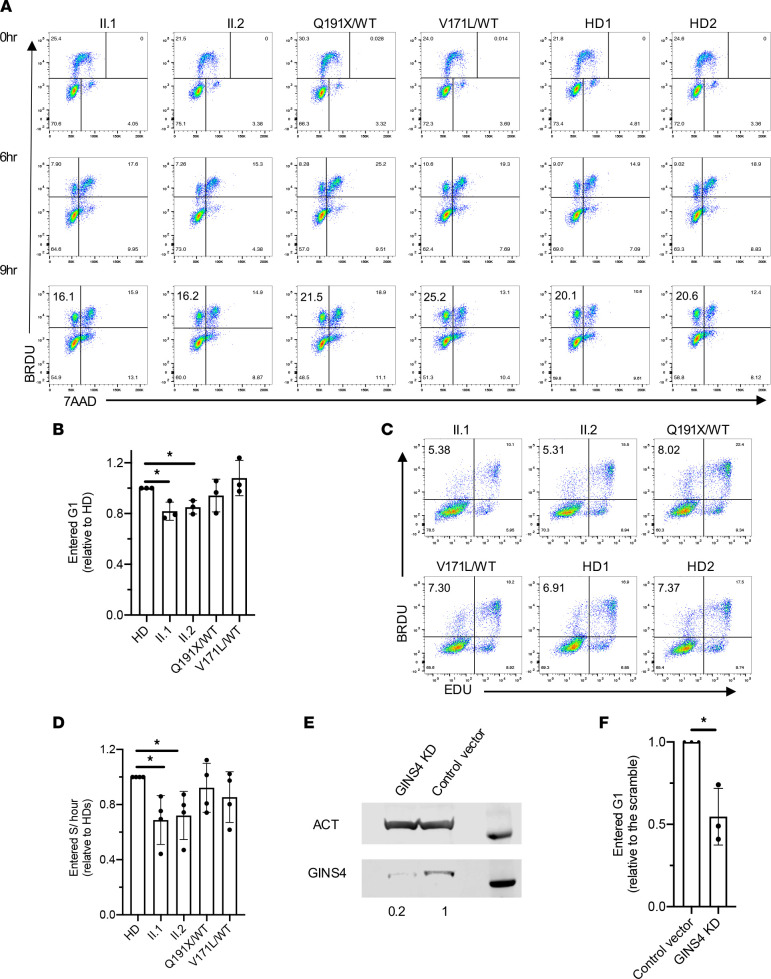
Figure 4. Individual-derived BLCLs and GINS4-KD RPE hTERT cells have a mild delay in cell cycle progression.
(A) Cell cycle progression analysis in GINS4 family members and 2 HD-derived BLCL at early passages, shortly pulsed with BrdU and analyzed by FACS after 6 and 9 hours. One representative experiment of 3 independent replicates is shown. (B) Relative frequency of 2N BrdU+cells shortly pulsed with BrdU and analyzed by FACS after 9 hours in family members’ BLCL compared with pooled HD showing the mean ± SD of 3 independent experiments. P ≤ 0.05 1-sample 2-tailed t test and Wilcoxon test. (C) Representative plots of EdU BrdU double pulse of siblings, healthy parents, and HD-derived BLCL. (D) Relative frequency of EdU−BrdU+ cells compared with pooled HD values showing the mean ± SD of 4 independent experiments. P ≤ 0.05 1-sample 2-tailed t test and Wilcoxon test. (E) Representative GINS4 expression in GINS4 KD and control vector RPE hTERT cell line by Western blot. Actin (ACT) is used as a loading control. (F) Relative frequency of 2N BrdU+ cells in GINS4 KD compared with the control vector displaying the mean ± SD of 3 independent experiments. P ≤ 0.05 1-sample 2-tailed t test and Wilcoxon test.

