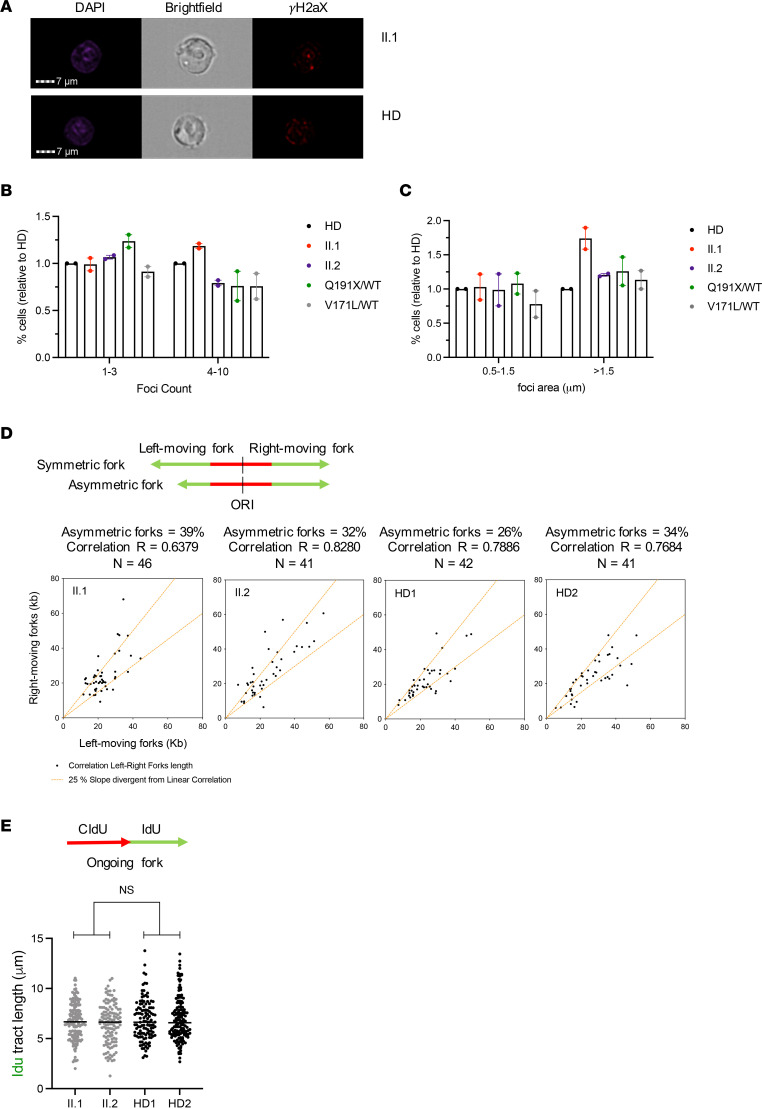
Figure 5. Individual-derived BLCLs do not show increased DNA damage or replication fork aberrations.
(A) Representative imaging flow cytometry images of individual II.1 and HD; DAPI (left), bright-field (center), and γH2aX (right) are shown. (B) Relative percentage of individuals’ cells with low foci count (1–3 foci) and high foci count (4–10 foci) compared with HD. Data show the mean ± range of 2 independent experiments. For each experiment, 5,000 cells were analyzed. (C) Relative percentage of individuals’ cells with low foci area (0.5–1.5 μm) and high foci area (>1.5 µm) compared with 1 HD. Data show mean ± range of 2 independent experiments. For each experiment, 5,000 cells were analyzed. (D) Analysis of fork symmetry in the indicated individual-derived BLCLs. A schematic representation of symmetric and asymmetric forks is shown. The graph shows the length of the left fork (x axis) plotted against the length of the right fork (y axis) for each replication origin (indicated with dot). The fork was considered asymmetric if the ratio between the left-fork length and the right-fork length deviated by more than 25% from 1. N represents the number of forks analyzed in 2 independent biological replicates. R represents the linear correlation coefficient. (E) Analysis of fork speed in the indicated individual-derived BLCLs. Dot plot graphs with the median of IdU tract lengths (μm) are shown and individual points are derived from 2 independent experiments. P ≥ 0.05 by Mann-Whitney U test.

