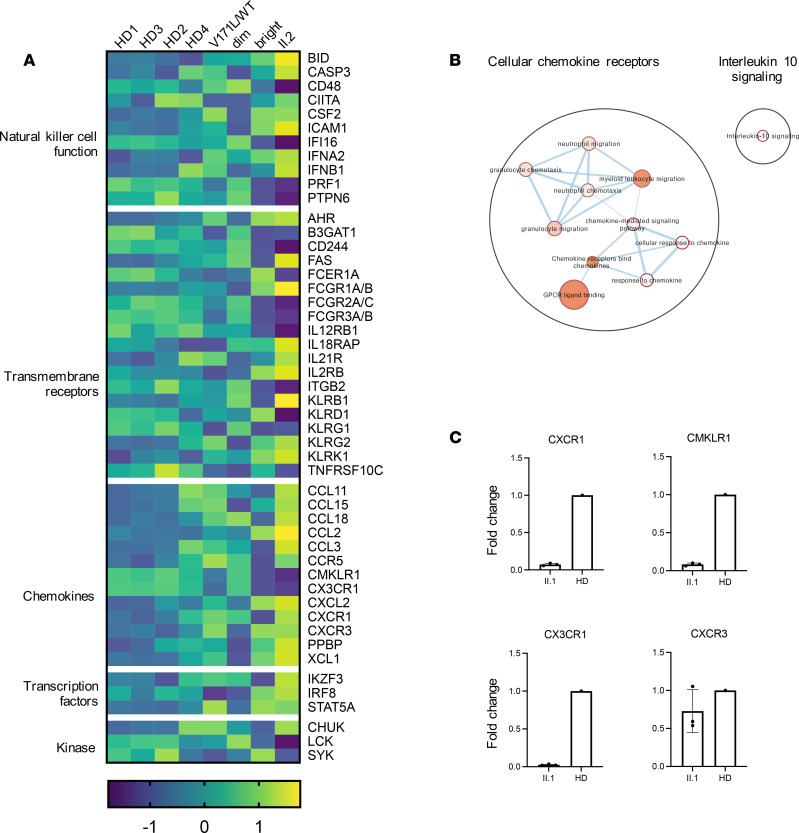
Figure 6. Immune profile of enriched primary NK cells demonstrates less mature NK cell phenotype.
(A) Heatmap of significantly deregulated expression of genes relevant to NK cell biology from enriched NK cells from individual II.2, her father (I.2), and 4 healthy donors, with sorted CD56bright and CD56dim NK cells from a single healthy donor also shown for reference. (B) Visualization of the pathway enrichment analysis performed with g:Profiler and visualized with Cytoscape. (C) Confirmatory qPCR analysis of CXCR1, CMKLR1, CX3CR1, and CXCR3 in proband II.1 compared with control.

