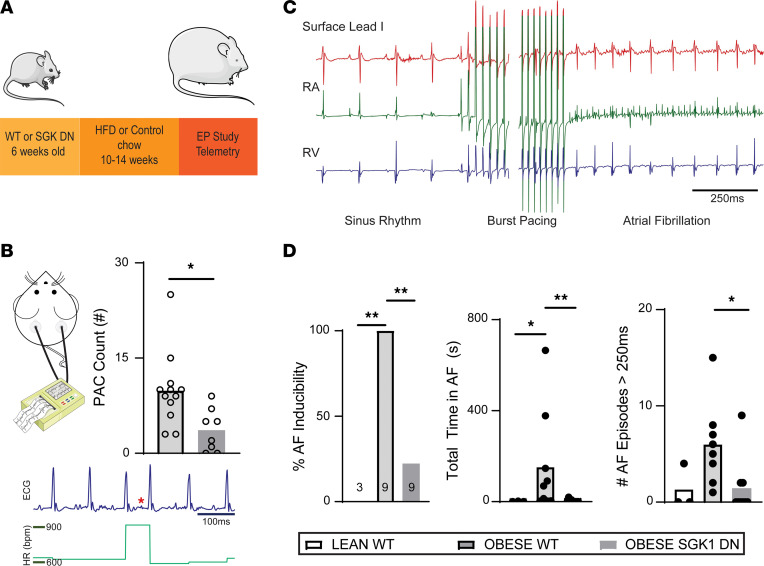
Figure 2. SGK1 DN mice are protected from obesity-induced AF.
(A) Schematic of mouse model used in these studies. (B) Frequency of premature atrial complexes (PACs) recorded during continuous telemetry recordings over an 8-hour period. Below the quantified plot is a representative telemetry tracing; the red star identifies an ectopic atrial P wave; and the dark blue scale bar is 100 ms. The green plot graphs heart rate (bpm) during the tracing of interest. Unpaired Student’s t test. *P < 0.05. (C) Example surface EKG and intracardiac tracing showing pacing-induced AF. (D) AF inducibility, by percentage inducible, of lean and obese mice (left); total summed duration of all AF episodes during each electrophysiology study (middle); and number of episodes of induced AF > 250 ms in duration by mouse (right). Fisher’s exact test for AF inducibility and Kruskal-Wallis test with post hoc Dunn’s test for duration/burden. *P < 0.05, **P < 0.01. Number of mice in each group is provided in bar graph or represented by the number of dots in individual figure.

