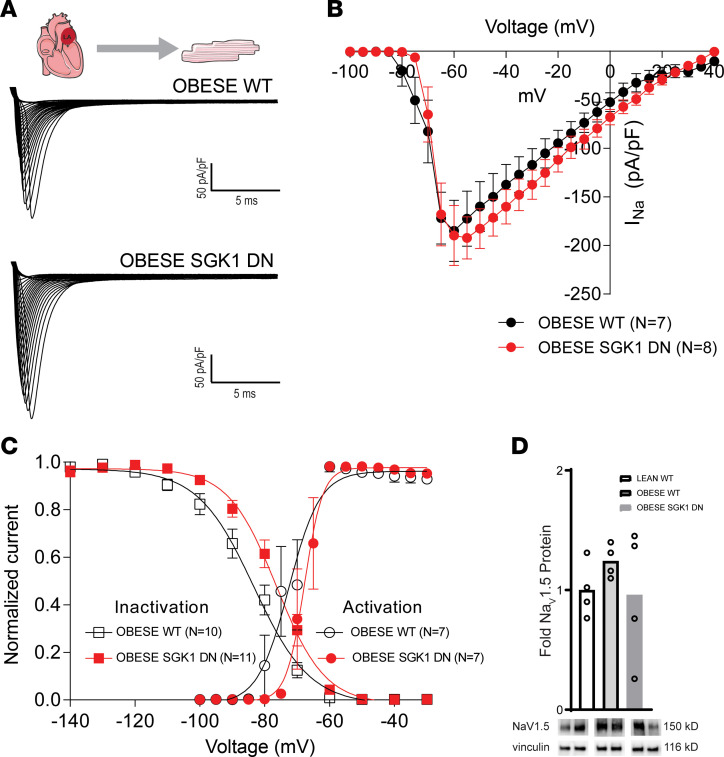
Figure 4. Effect of SGK1 genetic inhibition on INa in obese LA cardiomyocytes.
(A) Example INa recordings from isolated LA cardiomyocytes of obese WT and SGK1 DN mice. (B) Current-voltage relations in WT (black) and SGK1 DN (red) isolated left atria. (C) INa activation-inactivation voltage dependences for WT (black) and SGK1 DN (red) LA cardiomyocytes, demonstrating a rightward depolarizing shift in the SGK1 DN myocytes. (D) Atrial expression of NaV1.5 subunit with representative blots below. In B and C, data depicted as mean ± SEM. Number of mice in each group provided in legend or represented by the number of dots in individual figure.

