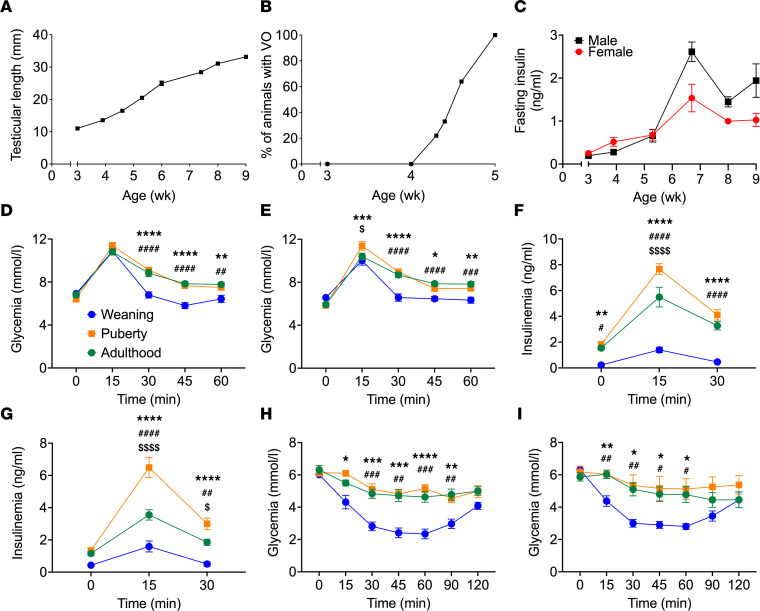
Figure 1. Puberty in female and male rats was associated with glucose intolerance and lower insulin sensitivity.
(A) Right testicular length in male rats (n = 6). (B) Percentage of female rats with vaginal opening (VO) (n = 18). (C) Fasting insulin levels in male (black square) and female (red circle) rats (n = 6–9). (D–G) Glycemia (D and E) and insulinemia (F and G) following IPGTT (1 g/kg) in male (D and F) and female (E and G) rats at weaning (3 wk of age, blue), puberty (~6 wk of age, orange), or young adulthood (~9 wk of age, green) (n = 10–15). (H and I) Glycemia following IPITT in male (H) and female (I) rats at weaning (3 wk of age, blue), puberty (~6 wk of age, orange), or young adulthood (~9 wk of age, green) (n = 6–8). Data are expressed as mean ± SEM. *P < 0.05, **P < 0.01, ***P < 0.005, ****P < 0.001 comparing puberty and weaning groups; #P < 0.05, ##P < 0.01, ###P < 0.005, ####P < 0.001 comparing the adult and weaning groups; and $P < 0.05, $$$$P < 0.001 comparing the puberty and adult groups following 2-way ANOVA (D–I) with Tukey’s multiple comparisons test.

