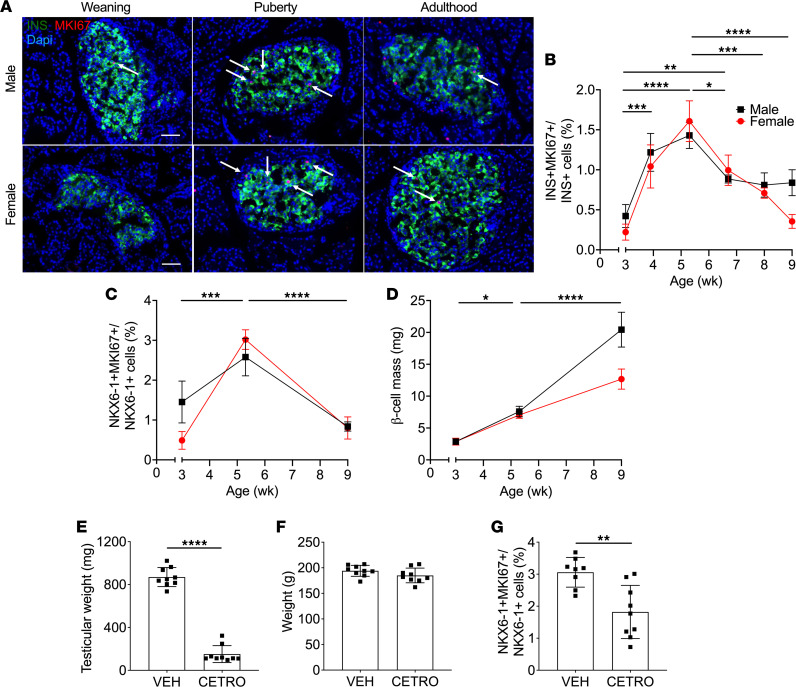
Figure 2. β Cell proliferation and mass were increased during puberty in rats, and β cell proliferation was blocked by GNRH1 antagonism.
(A–C) β cell proliferation as assessed by immunofluorescent staining of pancreatic sections for MKI67 and insulin (INS) (A and B) or NKX6-1 (C) in male and female rats from 3–9 wk of age. (A) Representative sections showing Ins (green), MKI67 (red), and nuclei (DAPI, blue) from male (top) and female (bottom) rats at weaning (3 wk of age), puberty (~5 wk of age), or young adulthood (9 wk of age). Arrows show positive nuclei for MKI67. Scale bars: 50 μm. (B and C) β Cell proliferation as a percentage of MKI67+INS+ cells over INS+ cells in males (black square) (n = 3–5) and females (red circle) (n = 3–5) (B), or as a percentage of MKI67+NKX6-1+ cells over NKX6-1+ cells in males (black square) (n = 6–8) and females (red circle) (n = 6–8) (C). (D) β Cell mass in males (black square) (n = 5–6) and females (red circle) (n = 5–6). (E–G) Male rats treated with Cetrorelix (CETRO; 100 μg/d) or vehicle (VEH) from D25 to D37 (n = 8–9). Right testicular weight (E), body weight (F), and β cell proliferation (G) were assessed at D38. β Cell proliferation was measured by immunofluorescent staining of pancreatic sections for MKI67 and NKX6-1 and presented as a percentage of MKI67+NKX6-1+ cells over NKX6-1+ cells. Data represent individual or mean values and are expressed as mean ± SEM. *P < 0.05, **P < 0.01, ***P < 0.005, ****P < 0.001 following 1-way ANOVA with Tukey’s multiple-comparison test (B–D) or following unpaired Student’s t test compared with the VEH group (E–G).

