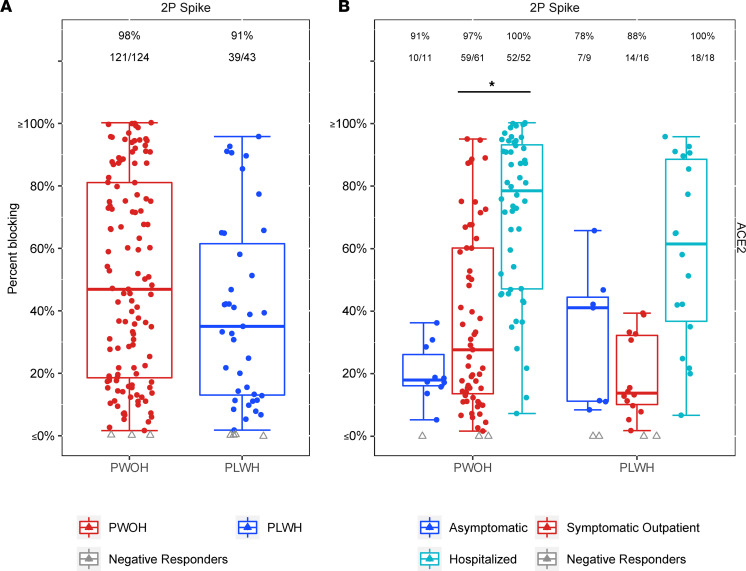
Figure 3. SARS-CoV-2 2P spike–specific percentage ACE2 receptor blocking by serum at enrollment as a function of HIV serostatus and peak COVID-19 symptom severity.
Colored dots, positive responders; gray triangles, nonresponders. Box plots represent the distribution for positive responders only. (A) Response rates and the number tested are above each box plot (red, PWOH; blue, PLWH). (B) Response rates are above each box plot. Peak COVID-19 symptom severity is listed as: blue, asymptomatic; red, symptomatic outpatient; teal, hospitalized. No significant differences were detected between PLWH and PWOH. However, percentage blocking increased for hospitalized PWOH compared with symptomatic outpatient PWOH (OR 3.37, P = 0.005). Logistic regression adjusting for peak COVID-19 symptom severity, diabetes, hypertension, COPD/emphysema/asthma, current and ever smoking, age, sex, BMI, race/ethnicity, region, and days since SARS-CoV-2 diagnosis was used. Asterisks and solid lines denote significant differences at P ≤ 0.05 level. For within-group significant differences between peak COVID-19 symptom severities, see Supplemental Table 5.

