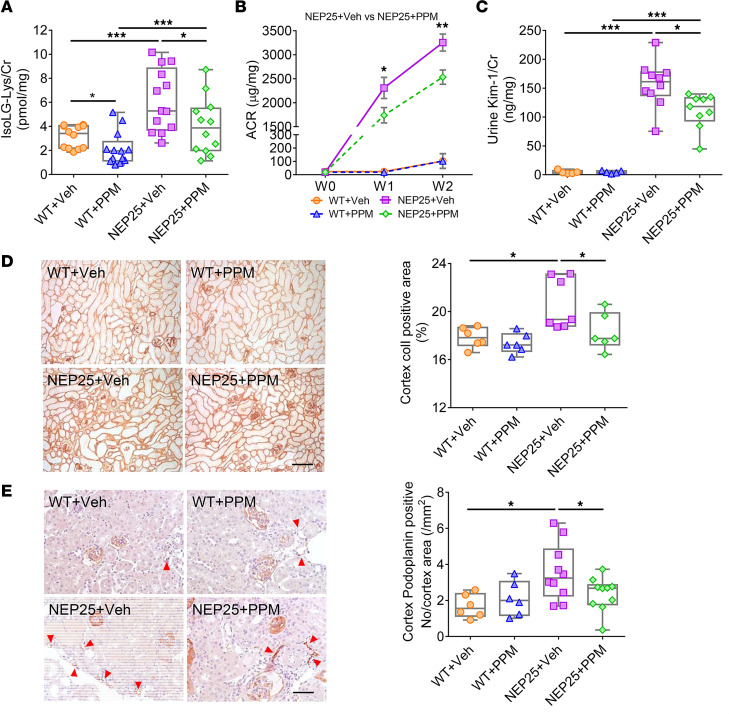
Figure 10. Dicarbonyl scavenger PPM improved kidney injury and attenuated lymphangiogenesis.
PPM treatment decreased urinary IsoLG adducts (A), albuminuria (B), and KIM-1 (C) in NEP25 mice compared with NEP25 mice treated with vehicle. (D) PPM treatment in NEP25 mice decreased renal cortical collagen I (colI) expression compared with vehicle-treated NEP25 mice. Scale bar: 100 μm. (E) Podoplanin immunostaining showed PPM treatment reduced kidney lymphangiogenesis in NEP25 mice compared with vehicle-treated NEP25 mice. Scale bar: 50 μm. n = 3–13 mice/group. Data represent box-and-whisker plot. Box plots show the interquartile range (box), median (line), and minimum and maximum (whiskers). Statistical significance determined by Kruskal-Wallis test followed by Wilcoxon rank sum tests and Bonferroni correction on P values. *P < 0.05, **P < 0.01, ***P < 0.001.

