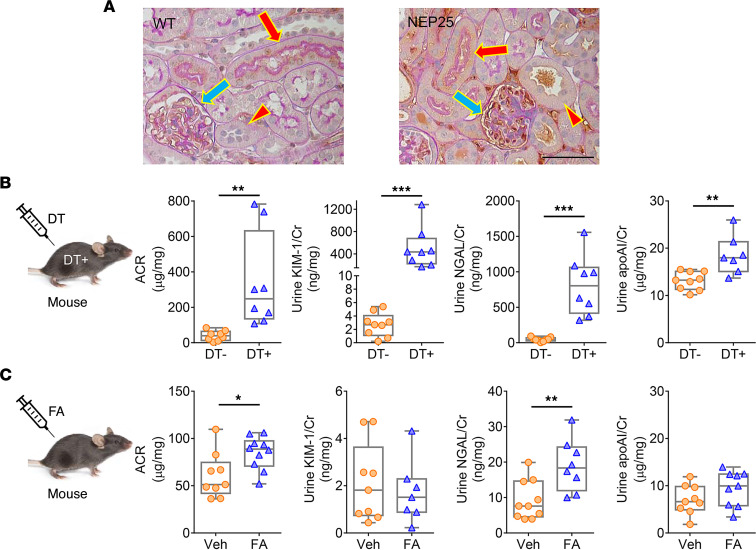
Figure 2. Distinct tubular handling of apoAI.
(A) Proteinuric NEP25 kidneys showed greater apoAI within the glomerular capillary tuft (blue arrow) versus WT. ApoAI costaining with periodic acid–Schiff showed greater apoAI expression in proximal tubular cells (red arrow) than distal tubular cells (red arrowhead). Scale bar: 50 μm. (B) Proximal tubular injury following injection of DT+ increased ACR, urinary KIM-1, NGAL, and urinary apoAI versus DT– mice. (C) FA-injected distal tubular injury mice had increased ACR and NGAL, but not KIM-1, and no change in urinary apoAI excretion. n = 6–12 mice/group. Data represent box-and-whisker plot. Box plots show the interquartile range (box), median (line), and minimum and maximum (whiskers). Statistical significance determined by Wilcoxon rank sum test. *P < 0.05, **P < 0.01, ***P < 0.001.

