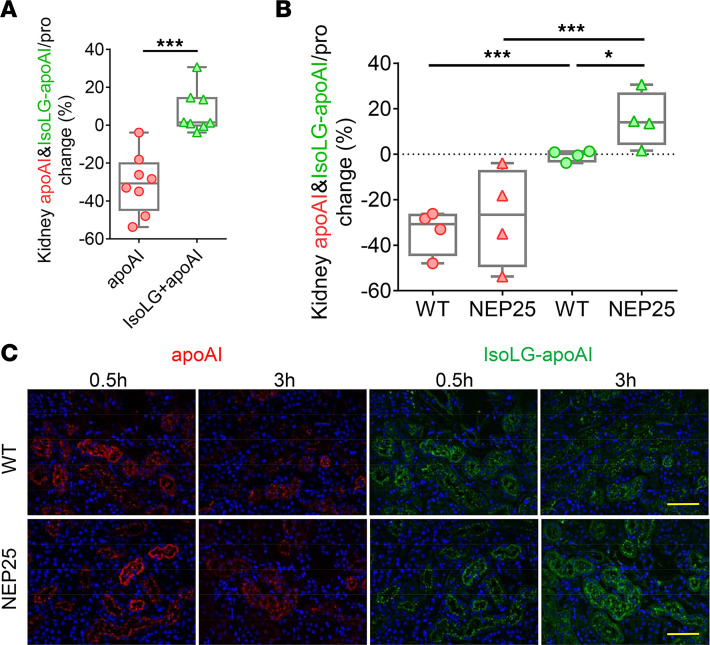
Figure 6. Proteinuric NEP25 mice show accumulation of IsoLG-apoAI versus apoAI.
(A) Kidney clearance of fluorescence-labeled apoAI (red) was more rapid compared with IsoLG-apoAI (green). (B) Fluorescence-labeled apoAI (red) was similarly cleared by NEP25 and WT mice. In contrast, fluorescence-labeled IsoLG-apoAI (green) persisted in NEP25 kidneys versus WT 3 hours after injection. (C) Representative kidney images of fluorescent apoAI (red) and IsoLG-apoAI (green). Scale bar: 50 μm. n = 4 mice/group. Data represent box-and-whisker plot. Box plots show the interquartile range (box), median (line), and minimum and maximum (whiskers). Statistical significance determined by Kruskal-Wallis test and Wilcoxon rank sum test on P values. * P < 0.05, ***P < 0.001.

