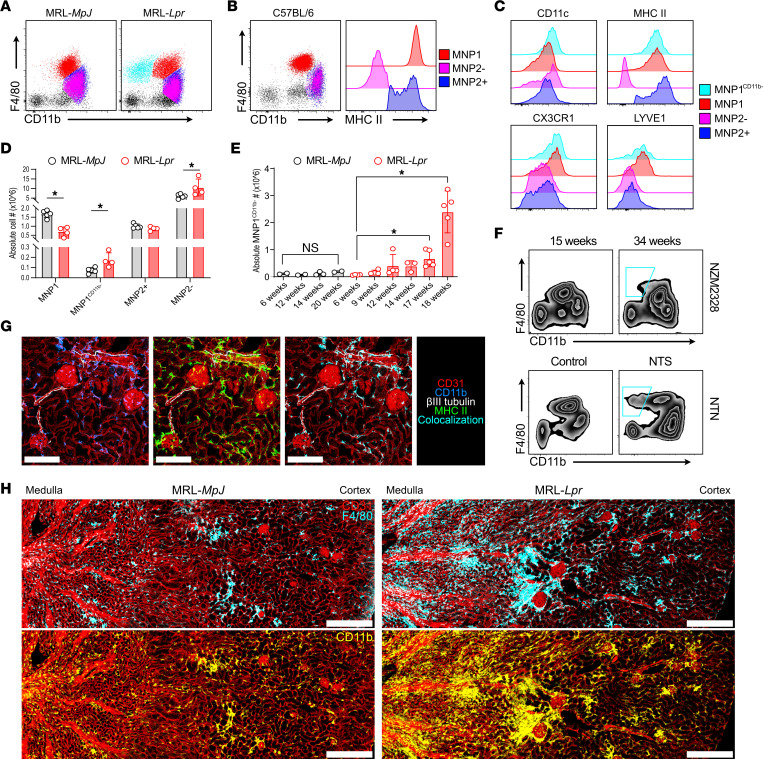
Figure 1. Expanded kidney macrophage populations in lupus nephritis.
(A) Representative CD11b versus F4/80 expression by kidney MNPs in MRL-MpJ (left) and MRL-Lpr (right) mice. (B) Representative CD11b versus F4/80 and MHCII expression by kidney MNPs in C57BL/6 mice with cells identified as MNP1 (F4/80hiCD11bintMHCIIhi), MNP2+ (F4/80intCD11bhiMHCII+), and MNP2– (F4/80intCD11bhiMHCII–). (C) Surface expression of CD11c, MHCII, CX3CR1, and LYVE-1 by kidney MNP subsets in MRL mice. (D) Absolute cell numbers of kidney MNPs in 16-week-old MRL-MpJ and MRL-Lpr mice. n = 5–6 animals per group from 2 separate experiments. *P < 0.05, Mann-Whitney test with Benjamini, Krieger, and Yekutieli posttest. (E) Absolute numbers of MNP1CD11b- per kidney in MRL-MpJ and MRL-Lpr mice with age. n = 2–5 animals per group. *P < 0.05, Mann-Whitney test. (F) Representative CD11b and F4/80 expression by kidney MNPs in young and old NZM2328 mice (top, n = 5) and following administration of nephrotoxic serum in C57BL/6 mice (bottom, n = 6). The cyan outline represents the MNP1CD11b– population in the 34-week-old NZM2328 mouse and the mouse that received NTS. (G) Representative confocal microscopy (n = 3) on murine C57BL/6 kidney showing MNP distribution around peritubular, afferent/efferent blood vessels and glomeruli (CD31, red) as well as surrounding nerves (βIII tubulin, white) through expression of CD11b (blue) and MHCII (green). Scale bar = 150 μm. (H) Representative confocal microscopy (n = 4) showing MNP distribution in kidneys from 18-week-old MRL-MpJ (left) and MRL-Lpr (right) mice through expression of F4/80 (cyan) and CD11b (yellow) relative to blood vessels (CD31, red). Scale bar = 300 μm. int, intermediate; NTS, nephrotoxic serum; NTN, nephrotoxic nephritis.

