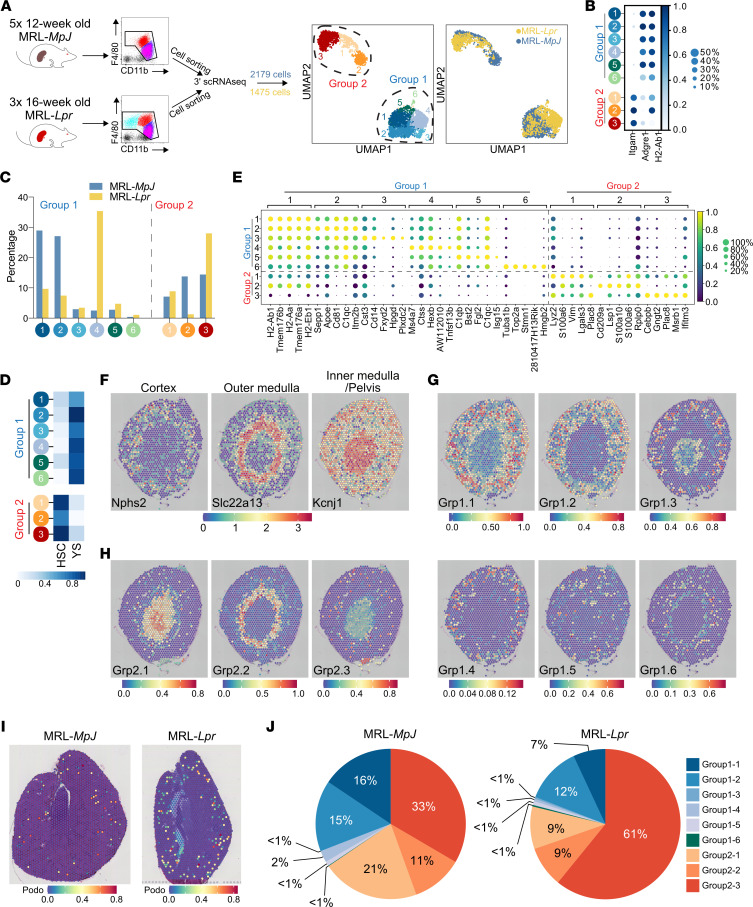
Figure 2. Lupus nephritis–associated macrophage heterogeneity at single-cell resolution.
(A) Illustration of single-cell experiment setup (left panels) and uniform manifold approximation and projection (UMAP) embedding of 2,179 macrophages from MRL-MpJ and 1,475 macrophages from MRL-Lpr mice (right panels). (B) Mean expression dot plot of genes Itgam (CD11b), Adgre1 (F4/80), and H2-Ab1 (MHCII). (C) Proportion of cells found in each cluster and mouse strain. (D) Heatmap of mean AUCell enrichment of F4/80hi/lo gene sets, corresponding to yolk sac (YS) versus hematopoietic stem cell (HSC) lineage. (E) Mean expression dot plot of top 5 significant marker genes for each MNP cluster. Marker genes were identified using Wilcoxon rank sum test, and P (adj) < 0.05 was considered statistically significant. (F) Spatial expression of markers used to delineate the anatomical regions in Visium Spatial Gene Expression data of C57BL/6 kidney sections (Kcnj1 — pelvis, Slc22a13 — proximal tubules, and Nphs2 — glomeruli). (G) Spatial transcriptomics of group 1 macrophage signatures in C57BL/6 murine kidneys with annotated scRNA-Seq data above. Each spot/voxel denotes a prediction score of 0–1 for the location of each of the macrophage subgroups. (H) Spatial transcriptomics (ST) of group 2 macrophage signatures in C57BL/6 murine kidneys with annotated scRNA-Seq data above. Each spot/voxel denotes a prediction score of 0–1 for the location of each of the macrophage subgroups. (I) ST of podocyte signature in MRL-MpJ (left) and MRL-Lpr (right) kidneys to identify glomerulus-containing spots/voxels. (J) Average proportion of each macrophage subset signature in spots/voxels identified in I in the MRL-MpJ (left) and MRL-Lpr (right) kidneys.

