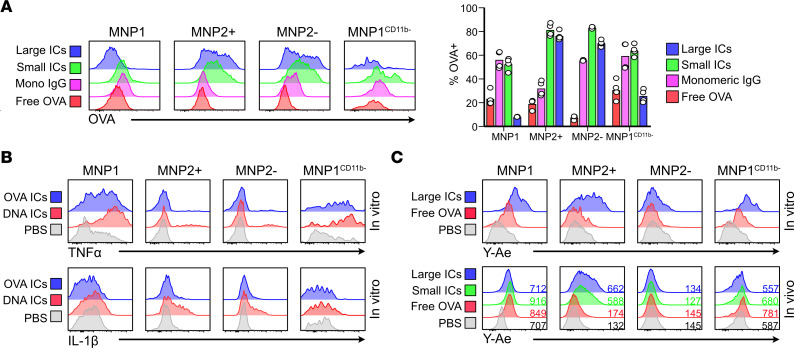
Figure 4. Kidney macrophages produce cytokines and present antigen upon IC uptake.
(A) (Left) Uptake of free and immune complexed AF647-OVA by kidney MNPs in vivo 2 hours following intravenous injection in C57BL/6 mice. 5:1 (large), 1:1 (small), and 1:5 (monomeric) molar ratios of rabbit IgGs/OVA were used. (Right) Uptake of free and immune complexed AF647-OVA by kidney MNPs in vivo 2 hours following intravenous injection in C57BL/6 mice. n = 2–4 mice per group from 2 separate experiments. (B) Representative expression (n = 3) of TNF-α (top) and IL-1β (bottom) by each MNP subset after 2 hours of stimulation in vitro with the appropriate condition. (C) Antigen presentation by kidney MNPs in vitro (top, n = 3) 2 hours following stimulation with free or immune complexed Eα-AF647-OVA or in vivo (bottom, n = 4–6 from 2 separate experiments) 4 hours following intravenous injection of free or immune complexed Eα-AF647-OVA in C57BL/6 mice. The number indicates the average gMFI for this channel. AF647, Alexa Fluor 647; gMFI, geometric mean fluorescence intensity.

