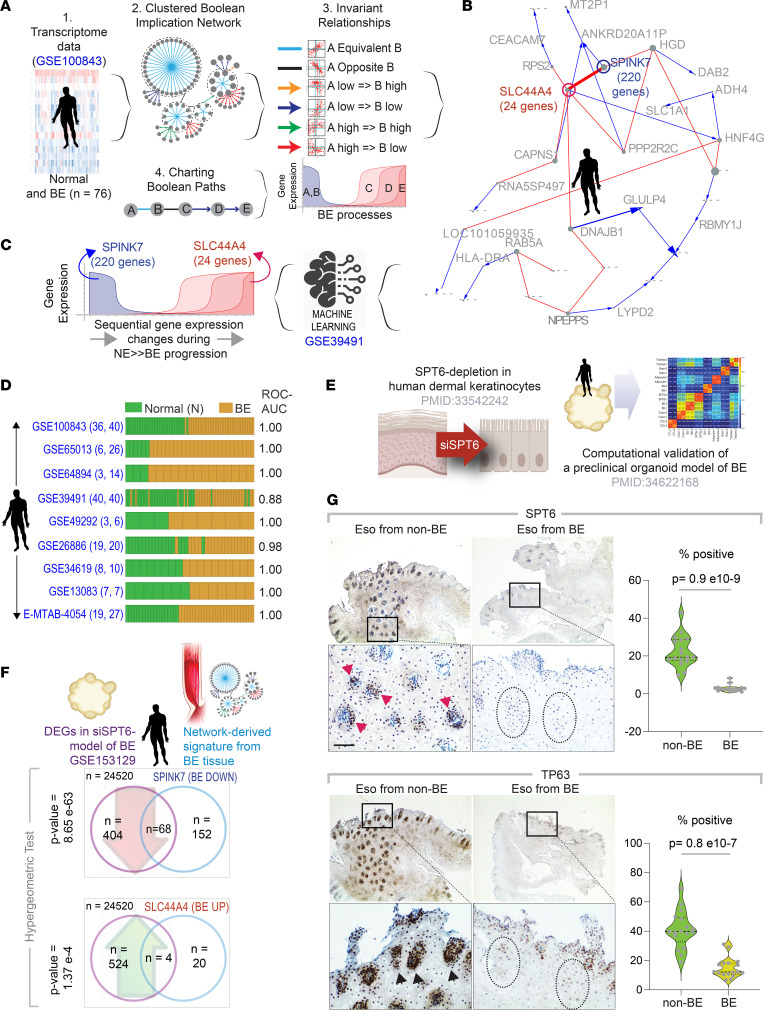
Figure 2. Generation and validation of Boolean network map of BE.
(A) Schematics outline the workflow (steps 1–4) and training data sets used to create a Boolean map of NE to BE transition using BoNE(4). (B) Graph showing invariant patterns of gene expression changes during NE→BE progression. Gene clusters identified by machine learning are indicated in bold. (C) Gene clusters in B were refined by filtering through a second data set (GSE39491). The resultant signature involves progressive downregulation of SPINK7 cluster with a concomitant upregulation of SLC44A4 cluster. (D) Bar plots show sample classification accuracy across diverse data sets, with corresponding ROC-AUC values. The sample numbers for healthy (H) and BE analyzed in each data set are annotated on the left margin. (E and F) Summary (E) of a published SPT6-depleted organoid model of BE. Hypergeometric statistical analyses (F) show significant overlaps in both up- and downregulated genes between gene signatures identified in the BE maps in B and C and differentially expressed genes in the SPT6-depleted organoid model of BE (5). (G) Esophageal biopsy specimens from men with (Eso from BE) or without (Eso from non-BE) BE were analyzed for SPT6 and TP63 expression by IHC. Red and black arrowheads point to crypts staining positive. Interrupted circles highlight crypts with little or no expression. Fields representative from 3 participants are shown; boxed regions above are magnified below. Scale bar: 100 μm. Violin plots display the percentage of cells positive for staining in regions of interest in G, as determined by the ImageJ plug-in, IHC profiler. P values were determined by 2-tailed Mann-Whitney test. DEG, differentially expressed gene.

