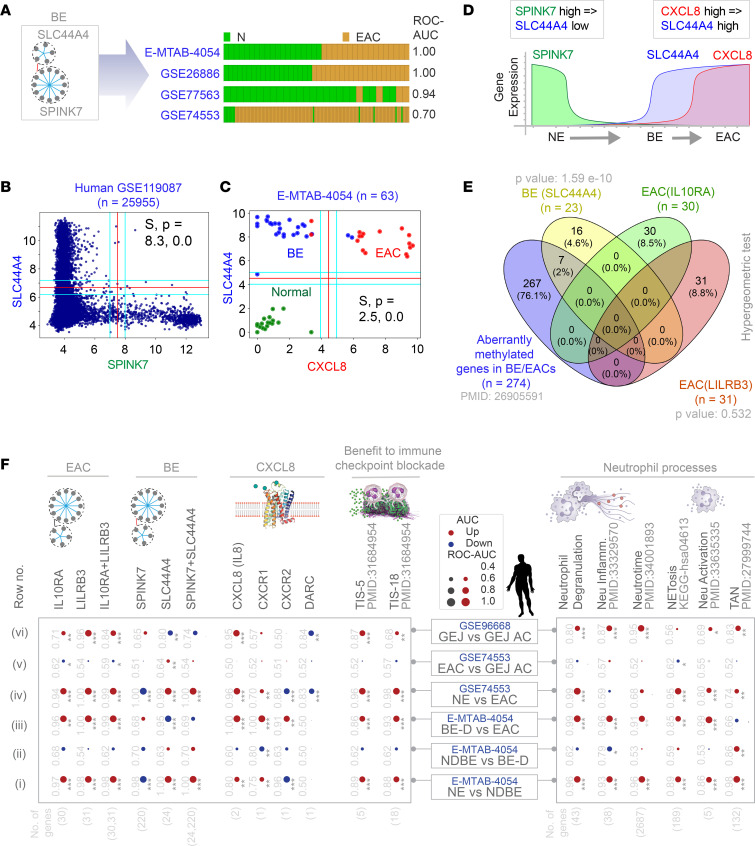
Figure 4. A Boolean logical model of cellular states during NE→BE→EAC progression.
(A) Bar plots show that BE signatures (Figure 2, B and C) can distinguish NE and EAC samples. (B) A scatterplot for SPINK7 and SLC44A4 expression in the global human GSE119087 (N = 25,955) data set. Boolean implication SPINK7-high => SLC44A7-low (S = 8.3; P = 0.0; FDR < 0.001) is an invariant relationship in the most diverse data set. (C) A scatterplot of CXCL8 and SLC44A4 expression in the E-MTAB-4054 data set. Boolean implication CXCL8-high => SLC44A4-high (S = 2.5; P = 0.0; FDR <0.001) is an invariant relationship in NE, BE, and EAC samples. (D) A schematic to visualize the mathematical model of NE→BE→EAC progression based on MiDReG analysis using BIRs. The model suggests that BE (SLC44A4 high, CXCL8 low) must precede EAC (CXCL8 high, SLC44A4 high). (E) Venn diagram shows the overlaps between the gene clusters from the BE and EAC maps with the genes reported to be methylated in multiple independent studies (n = 274 of 22,178 genes tested in total). Only significant P values, as determined using hypergeometric analyses, are displayed. (F) The human EAC immune microenvironment is visualized as bubble plots of ROC-AUC values (radius of circles are based on the ROC-AUC) demonstrating the direction of gene regulation (upregulation, red; downregulation, blue) for the classification of samples (gene signatures in columns; data set and sample comparison in rows). P values based on Welch’s t test (of composite score of gene expression values) are provided using standard code (*P ≤ 0.05, **P ≤ 0.01, ***P ≤ 0.001) next to the ROC-AUC. Left: Panel displays the classification of NE, NDBE, DBE, EAC, and GEJ-AC based on the indicated gene signatures (top) in 2 independent data sets (E-MTAB-4054, GSE74553). Right: Panel displays the classification of the same samples based on neutrophil signatures. Violin plots for selected neutrophil signatures are displayed in Supplemental Figure 5.

