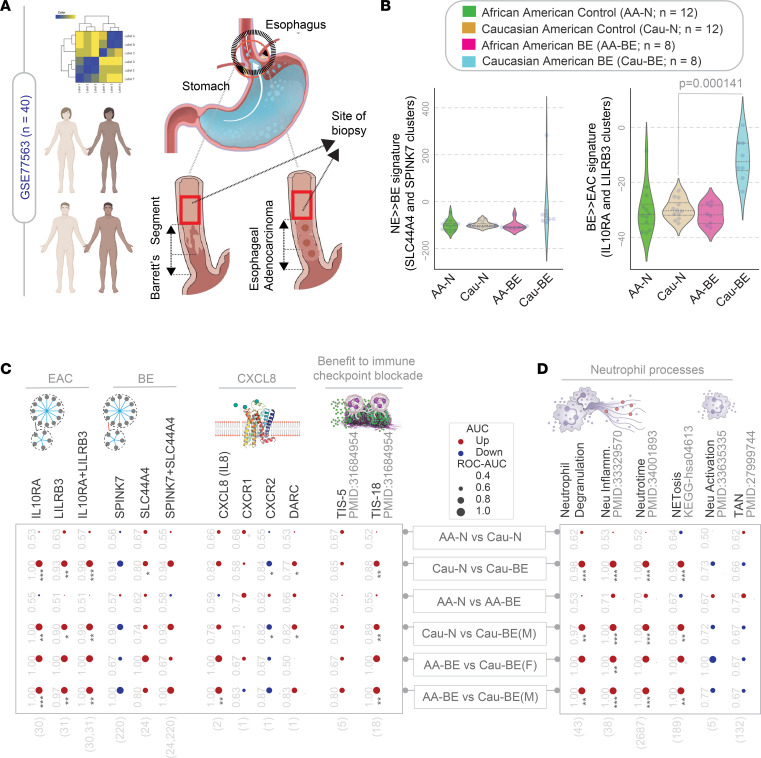
Figure 6. White individuals, but not AAs, mount IL-8– and neutrophil-centric inflammation.
(A) Schematic displays the study design in data set GSE77563. Microarray studies were conducted on histologically normal squamous mucosa from self-identified AA or White participants, who were healthy (normal control participants), or those diagnosed with BE and/or EAC (AA-BE or White-BE). (B) Violin plots showing the composite scores of upregulated gene clusters (Left, BE signatures; Right, EAC signatures) in control participants (AA-N and White-N) and those diagnosed with BE/EACs (AA-BE and White-BE). P values indicate comparison of each sample against the normal samples, as determined by Welch’s t test. (C and D) The human EAC immune microenvironment is visualized as bubble plots of ROC-AUC values (radius of circles are based on the ROC-AUC) demonstrating the direction of gene regulation (upregulation, red; downregulation, blue) for the classification of samples (gene signatures in columns; data set and sample comparison in rows). P values (*P ≤ 0.05, **P ≤ 0.01, ***P ≤ =0.001) based on Welch’s t test (of composite score of gene expression values) are provided next to the ROC-AUC. (C) The classification of AA vs. White samples from control (AA/White-N) or BE/EAC participants (AA/White-BE) in male (M) or female (F) participants are shown based on the indicated gene signatures (top) in GSE77563. (D) The classification of same samples in C based on neutrophil signatures. Violin plots for selected neutrophil signatures in AA-BE vs. White-BE samples are displayed in Supplemental Figure 8. neu inflamm., neutrophil inflammation.

