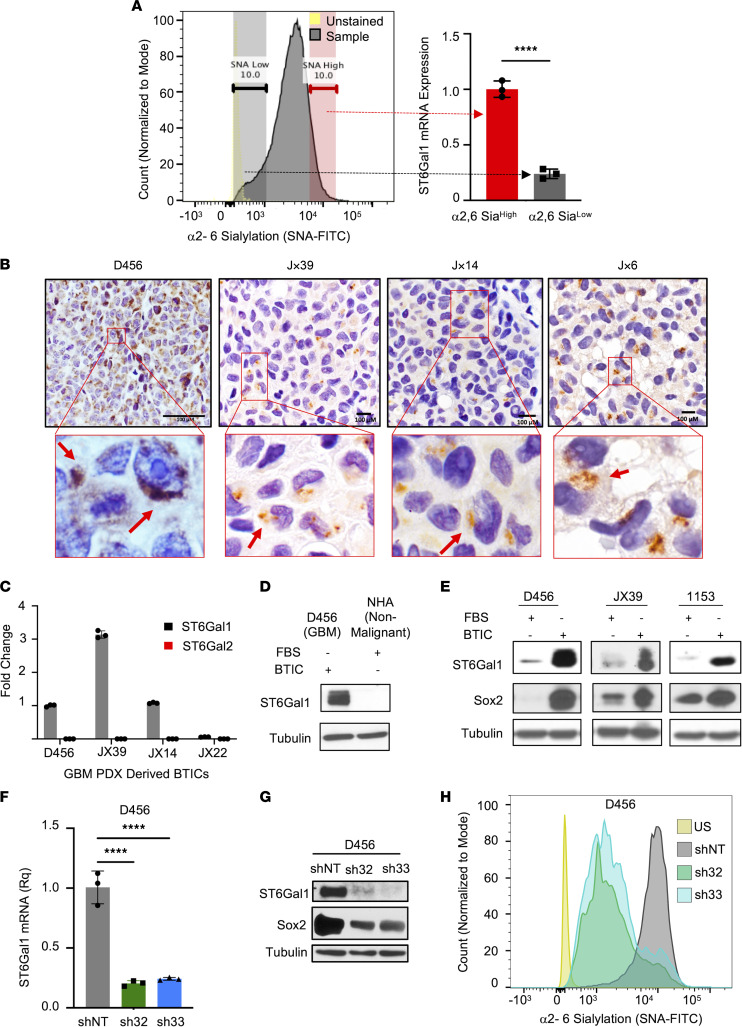
Figure 2. ST6GAL1 is expressed in GBM and elevated in BTICs to increase α2,6 sialylation.
(A) Example histogram of FACS with SNA-FITC to identify α2,6 sialylationhi and α2,6 sialylationlo cells that were lysed after sorting and ST6GAL1 mRNA levels determined using qRT-PCR. Relative quantification (Rq) is normalized to SNAhi. Individual data points are shown with the error bars as mean ± SD (n = 3). ****P < 0.0001 with 2-tailed t test. The experiments were repeated in at least 3 independent biological replicates. Data from 1 representative experiment are shown. (B) IHC of ST6GAL1 in sections of 4 different s.c. human GBM xenografts. From left, D456, JX39, Jx14, and JX6. Image objective D456 40x and JX39, Jx14, and JX6 60x oil immersion. Scale bars: 100 μm. The red box represents the section from which the magnified images were collected. The red arrows indicate punctate Golgi staining for ST6GAL1. (C) mRNA levels of ST6GAL1 or ST6GAL2 in BTICs isolated from the indicated GBM xenografts; Rq for individual PDX is normalized to D456. Individual data points are shown with the error bars as mean ± SD (n = 3). The experiments were repeated in at least 3 independent biological replicates. Data from 1 representative experiment are shown. (D) ST6GAL1 protein levels in nonmalignant brain cells (NHA) or GBM (D456) were determined via IB. NHA, normal human astrocytes. (E) ST6GAL1 protein levels in BTICs or BTICs differentiated in FBS for 96 hours were determined via IB. Differences in expression of the BTIC marker SOX2 were used as control. The experiments were repeated in at least 3 independent biological replicates. Data from 1 representative experiment are shown. (F–H) Lentivirus was used to transduce D456 cells with nontargeting control shRNA (shNT) or 2 different shRNA constructs targeting ST6GAL1 (sh32 and sh33). Cells for analysis and experiments were collected after 24 hours of lentivirus exposure and 72 hours of antibiotic selection. (F) KD of ST6GAL1 mRNA was validated using qRT-PCR. Individual data points are shown with the error bars as mean ± SD (n = 3). ****P < 0.0001 with 1-way ANOVA. (G) KD of ST6GAL1 protein was validated with IB. SOX2 expression in the shNT compared with the KD groups were determined via IB. (H) Representative histogram of FACS analysis with SNA-FITC of BTICs with and without ST6GAL1 modulation in D456 PDX cells demonstrating reduced α2,6 sialylation. The experiments were repeated in at least 3 independent biological replicates. Data from 1 representative experiment are shown.

