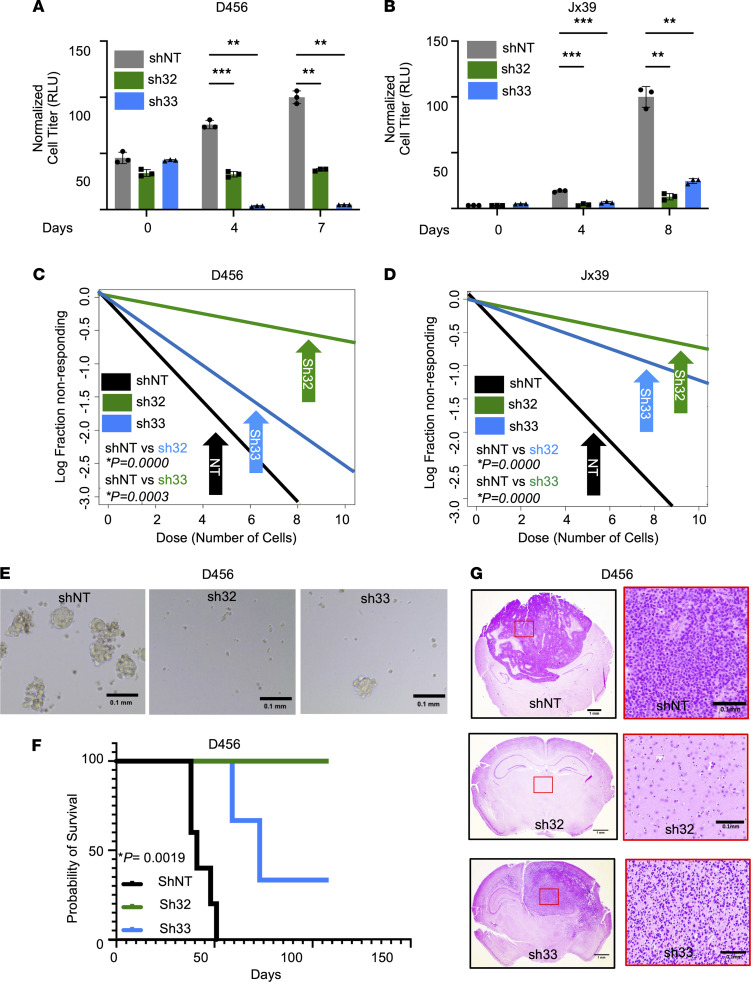
Figure 3. Targeting ST6GAL1 decreases GBM growth and self-renewal.
Growth of (A) D456 and (B) Jx39 BTICs with (sh32, sh33) and without (nontargeting control, shNT) ST6GAL1 was measured over time using CellTiter-Glo 2.0 (luminescence, RLU). Individual data points are shown with the error bars as mean ± SD (n = 3). **P < 0.01; ***P < 0.001, 2-way ANOVA with Tukey’s multiple comparisons test. The experiments were repeated in 3 independent biological replicates. Data from 1 representative experiment are shown. BTIC frequencies were compared using in vitro limiting dilution assays with (C) D456 and (D) Jx39 BTICs with and without ST6GAL1 KD. Each group was plated in decreasing number of cells (100, 50, 10, 5, and 1 cell per well). ELDA was done using the software (http://bioinf.wehi.edu.au/software/elda/). P values were calculated from chi-square analysis of group comparisons. The experiments were repeated in at least 3 independent biological replicates. Data from 1 representative experiment are shown. (E) Representative images of D456 neurospheres at day 7 at 4× magnification. Scale bar: 0.1 mm. (F) Kaplan-Meier survival curves for BalbC nu/nu mice injected orthotopically with 5,000 shNT, sh32, or sh33 D456 BTIC cells and sacrificed upon development of neurological signs. The log-rank test was employed to calculate the indicated P value. (G) Representative histological images of tumors from F stained with H&E support the presence of brain tumors in mice with neurological signs. Left panels: Image objective = 1.25×; scale bar: 1.0 mm. Right panels: Image objective = 20×; scale bar: 0.1 mm.

