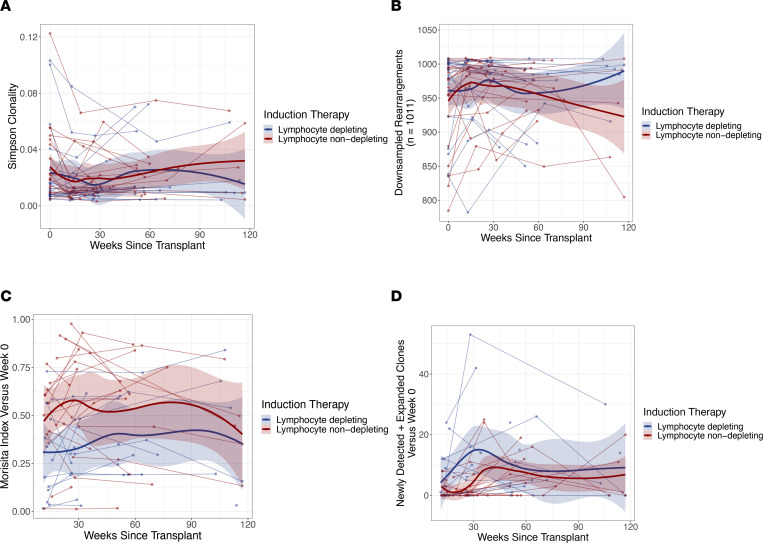
Figure 5. TCRβ repertoire following induction immunosuppressive therapy.
(A) Repertoire clonality, (B) repertoire richness, (C) repertoire turnover, and (D) newly detected and expanded clones were measured from time since transplant among patients who received lymphocyte-depleting or -nondepleting treatments. Each line represents an individual, and each dot represents a time point. Blue and red lines represent the locally estimated scatter plot smoothing (LOESS) curve for lymphocyte-depleting and -nondepleting groups, respectively. Gray shaded areas represent the 95% CI of the LOESS curves. One patient was an outlier in D and, therefore, was excluded from this analysis.

