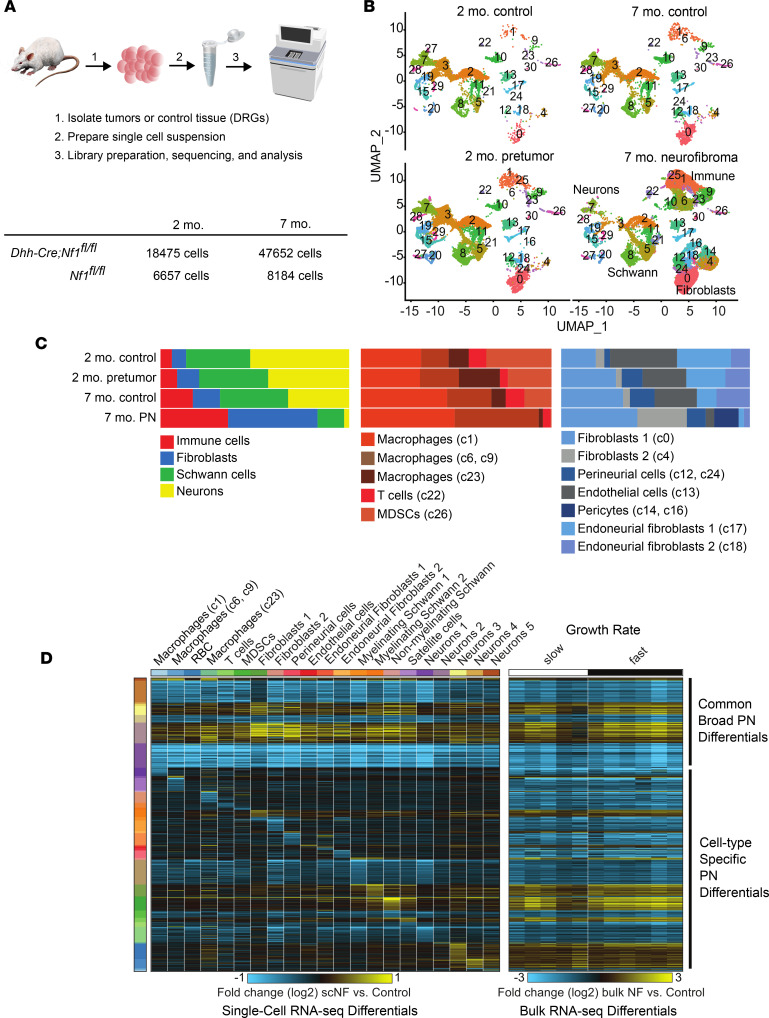
Figure 1. Immune and stromal cell increases in PNs occur long after SC loss of Nf1.
(A) Schematic of the analysis of control and PN cells by scRNA-seq showing analyzed cell numbers. (B) UMAPs of PNs (7-month Dhh-Cre;Nf1fl/fl), pretumor (2-month Dhh-Cre;Nf1fl/fl), and corresponding 7-month and 2-month Nf1fl/fl littermate controls, generated using Seurat. (C) Cell type frequencies across sample types showing all cell types (left); immune cells (middle), and stromal cells (right), showing enrichment of immune and stromal cell clusters in PNs. UMAP cluster numbers (from B) are shown in parentheses for each annotated cell type. (D) Left: Heatmap showing scRNA-seq gene fold changes in 7-month PN cells versus controls, generated using cellHarmony. Right: Differential expression of the same genes in bulk RNA-seq, analyzed as fold changes in 7-month PNs versus controls. The changes were independent of PN growth rate (fast/slow). Broad patterns of differential gene expression across cell types and cell type specific changes are evident.

