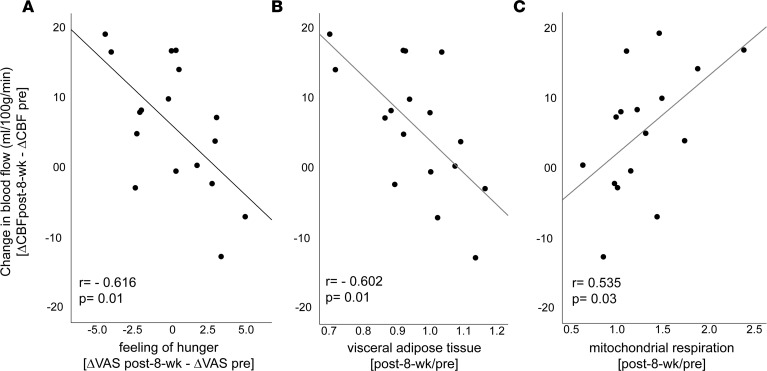
Figure 4. Change in brain insulin action after an 8-week exercise intervention associates with hunger ratings and metabolic measures.
(A) The y axis displays the change in right putamen blood flow in response to intranasal insulin from before to after the exercise intervention (ΔCBFpost-8-week – ΔCBFpre). The x axis shows the change in hunger ratings in response to intranasal insulin (ΔVASpost-8-week – ΔVASpre). (B) The fold change of visceral adipose tissue from before to after the 8-week exercise intervention. (C) The fold change of maximal coupled skeletal muscle mitochondrial respiration in skeletal muscle fibers from before to after the 8-week exercise intervention. CBF, cerebral blood flow; VAS, visual analogue scale.

