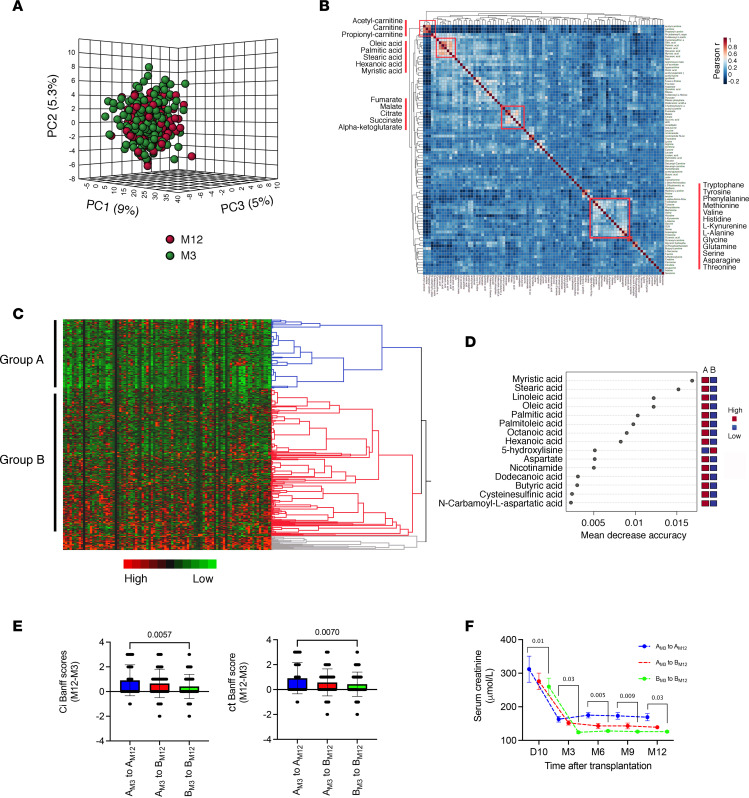
Figure 1. Urinary metabolome of KTRs after 3 and 12 months is enriched with long chain FAs.
(A) Dimension reduction by principal component analysis (PCA) of all the metabolites identified in the 498 KTR urine samples collected 3 and 12 months after kidney transplantation. The plot shows the 3D scores between the selected PCs that best explain the variance of metabolites. (B) Overall correlation heatmap between metabolites using Pearson’s r scores in the 498 KTR urine samples collected 3 and 12 months after kidney transplantation. (C) Heatmap showing hierarchical clustering using Ward’s algorithm for all the metabolites identified in 498 urine samples collected 3 and 12 months after kidney transplantation. Blue, red, and gray colors indicate the 3 distinct clusters of the largest size, including group A and B. (D) Significant metabolites identified by random forest classification between group A and B. Metabolite importance (top 15) is calculated by mean decrease in accuracy for classification between group A and group B. Number of trees = 500, out of bounds error rate = 0.152. Class error rate: group A = 0.28 and group B = 0.09. Features are ranked by the mean decrease in classification accuracy after permutation. Dark red indicates that a feature (a metabolite) is enriched in a group. (E) Distribution of variations in the difference in interstitial fibrosis (ci) and tubular atrophy (ct) Banff scores between month 12 and month 3 (M12 and M3), according to changes of groups identified by hierarchical clustering in B between M3 and M12. AM3 to AM12 group, n = 33; AM3 to BM12 group, n = 33; BM3 to BM12 group, n = 33. The box plots depict the minimum and maximum values (whiskers), the upper and lower quartiles, and the median. The length of the box represents the interquartile range. P values were computed with a 1-way ANOVA followed by a Dunnett’s multiple-comparison test. (F) Distribution of renal function (plasma creatinine) according to changes of groups identified by hierarchical clustering in B between M3 and M12. AM3 to AM12 group, n = 33; AM3 to BM12 group, n = 33; BM3 to BM12 group, n = 33. P values were computed with an ordinary 2-way ANOVA followed by a Dunnett’s multiple-comparison test.

