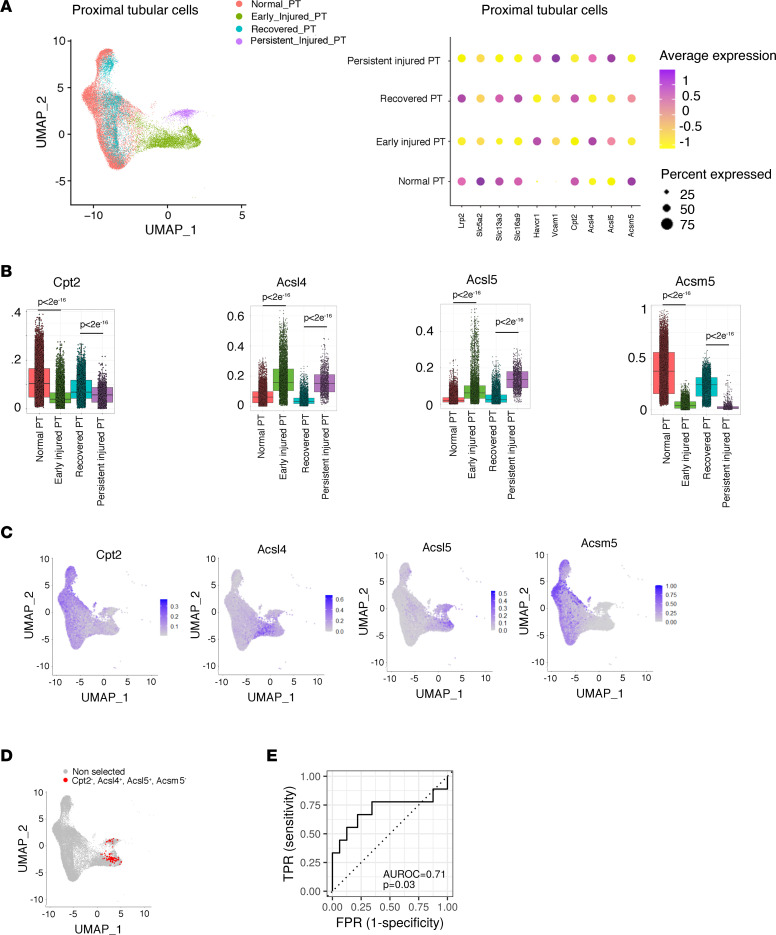
Figure 3. Dysregulation of FA metabolism persists in PTCs not recovering after AKI.
(A) Uniform manifold approximation and projection (UMAP) (left panel) and dot plot (right panel) representation of the PTCs (n = 27,148 nuclei) selected from pooled mouse IRI and control kidney samples analyzed at different time points by snRNA-Seq. PTCs are depicted according to the definition of cell states based on the relative expression of differentiation markers (Lrp2, Slc5a2, Slc13a3, Slc16a9) and stress markers (Havcr1 and Vcam1) and the time points: normal PT (positive for Lrp2, Slc5A2, Slc13a3, Slc16a9 before injury), early injured PT (Havcr1 positive at 4 hours, 12 hours, 48 hours after IRI), recovered PT (positive for Lrp2, Slc5A2, Slc13a3, Slc16a9 at 14 days and 6 weeks), and persistent injured PT (positive for Havcr1, Vcam1 at 14 days and 6 weeks). (B) Expression levels of Cpt2, Acsl4, Acsl5, and Acsm5 in normal PT, early injured PT, recovered PT, and persistent injured PT. Box plots depict gene expression after application of Markov Affinity-based Graph Imputation of Cells (MAGIC). The box plots depict the minimum and maximum values (whiskers), the upper and lower quartiles, and the median. The length of the box represents the interquartile range. Pairwise comparisons using Wilcoxon rank sum test with continuity correction exhibit significant differences in gene expression among the different PTC clusters. (C) FeaturePlot representation of the expression of Cpt2, Acsl4, Acsl5, and Acsm5 in PTCs (n = 27,148 nuclei) selected from pooled mouse IRI and control kidney samples analyzed at different time points by snRNA-Seq. (D) FeaturePlot highlights in red (n = 92 dots) the PTCs with normalized gene expression of Acsl4 > 0.2 and Cpt2 < 0.05 and Acsl5 > 0.2 and Acsm5 < 0.05 (full house signature). (E) Receiver operating characteristic curve, and its underlying area (AUROC), for a model (logistic regression) predicting the binary ci score (ci ≤ 1 vs. ci > 1) 12 months after transplantation, using the expression levels of ACSL4, ACSL5, ACSM5, and CPT2 in kidney allografts 3 months after transplantation. n = 41. P value has been calculated with a Mann-Whitney U test. TPR, true positive rate; FPR, false positive rate.

