Figure 2.

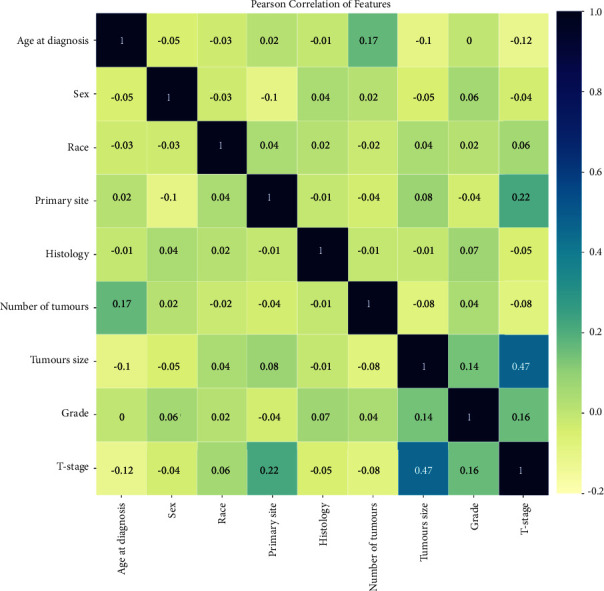
The results of the Pearson correlation analysis between all the variables. The heatmap shows the correlation between the variables.

The results of the Pearson correlation analysis between all the variables. The heatmap shows the correlation between the variables.