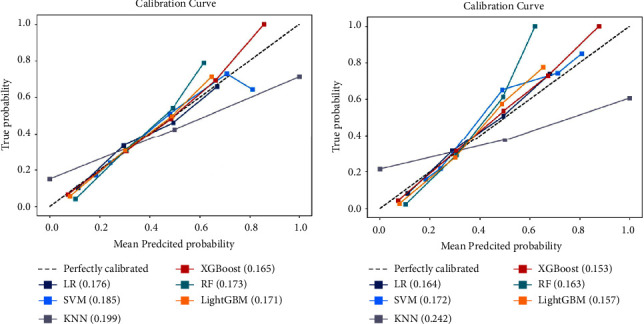
Figure 5.

Calibration curves for predicting LNM with various models. The 45 straight line on each graph represents the perfect match between the observed (y-axis) and predicted (x-axis) survival probabilities. A closer distance between two curves indicates greater accuracy. (a) Training set; (b) test set. Abbreviations: LNM, lymph node metastasis; XGBoost, extreme gradient boosting; SVM, support vector machine; KNN, k-nearest neighbor; LR, logistic regression; RF, random forest; LightGBM, light gradient boosting machine.
