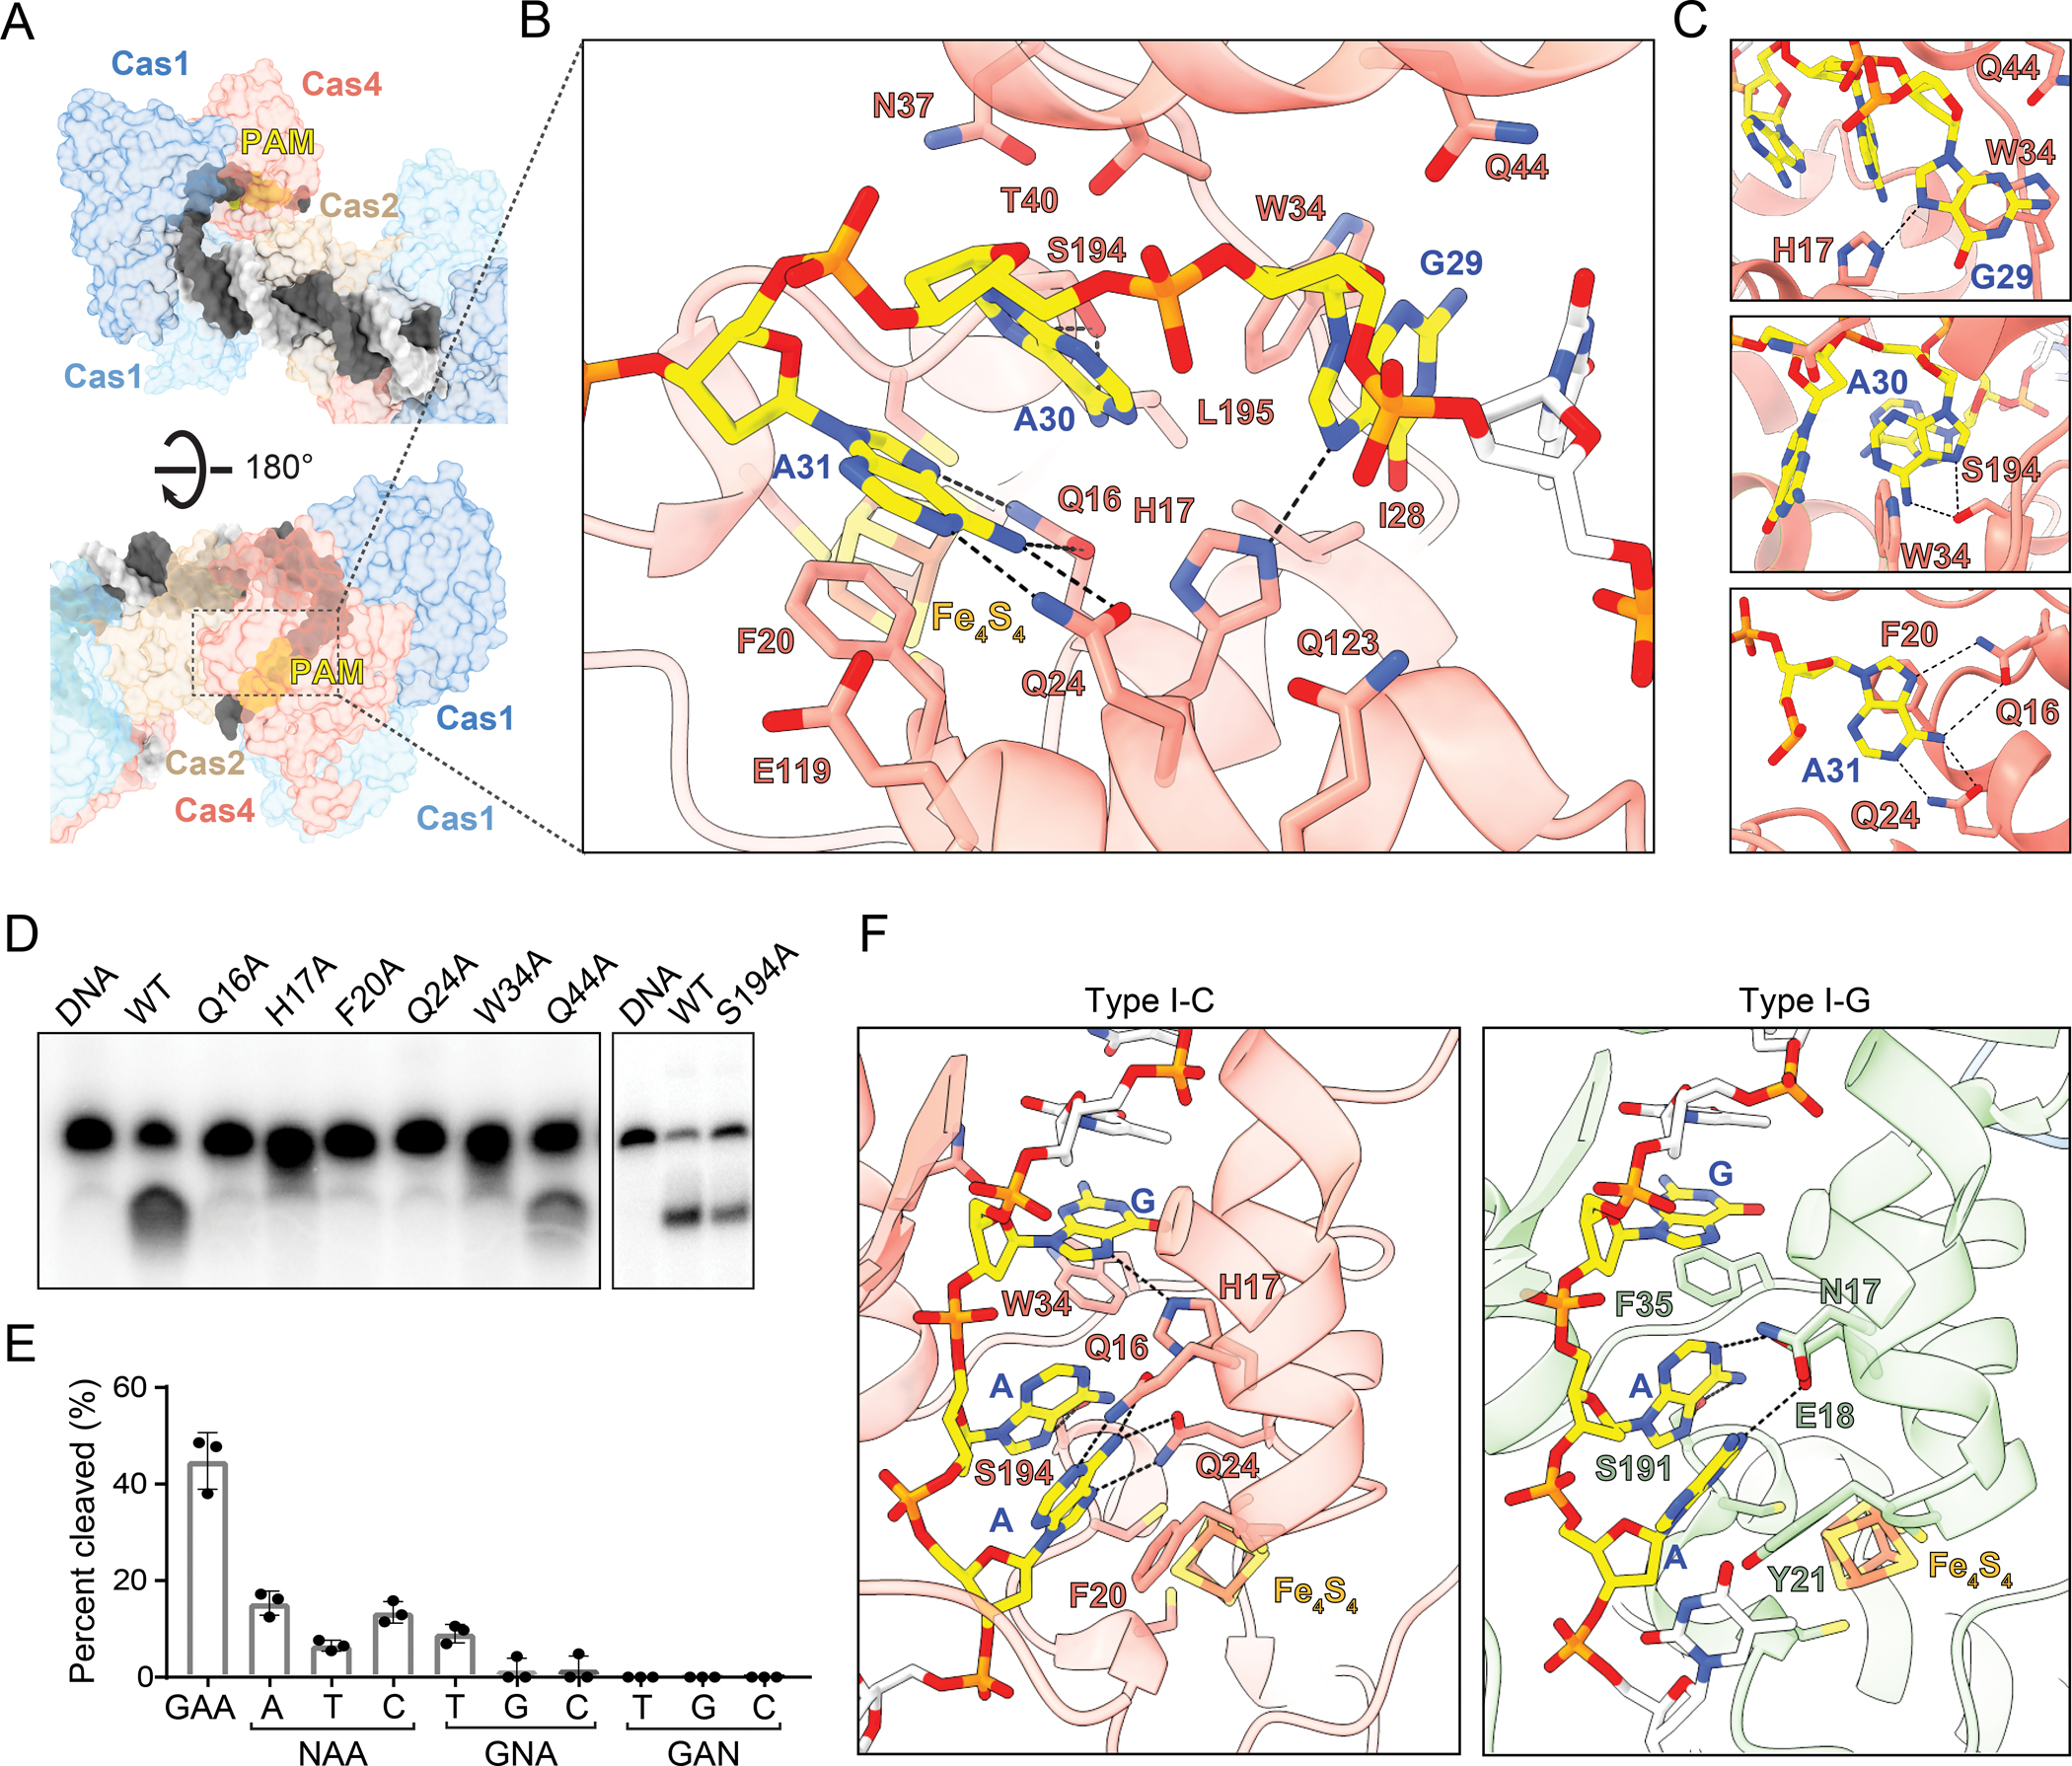
Figure 3: PAM recognition by Cas4.

(A) Surface view of single-stranded overhang travelling to Cas4 PAM recognition pocket.
(B) Specific and non-specific interactions between Cas4 residues (labeled in salmon with black outline) and PAM nucleotides (labeled in blue). Potential hydrogen bonds are shown as dashed lines.
(C) Close-up view of potential hydrogen bonds formed by individual PAM nucleotides.
(D) Polyacrylamide gel showing cleavage assay with PAM recognition mutants. The assay was performed with final concentrations of 250 nM Cas1, 250 nM Cas2 and 500 nM Cas4 and quenched at 30 minutes.
(E) Quantification of cleavage assay for saturation mutagenesis of each nucleotide in the PAM sequence, performed as in (D). N indicates the position that was mutated. The average of three replicates is shown, error bars represent standard deviation and the three data points are plotted as dots.
(F) Comparison of I-C and I-G Cas4 showing specific and stacking interactions for PAM recognition.
