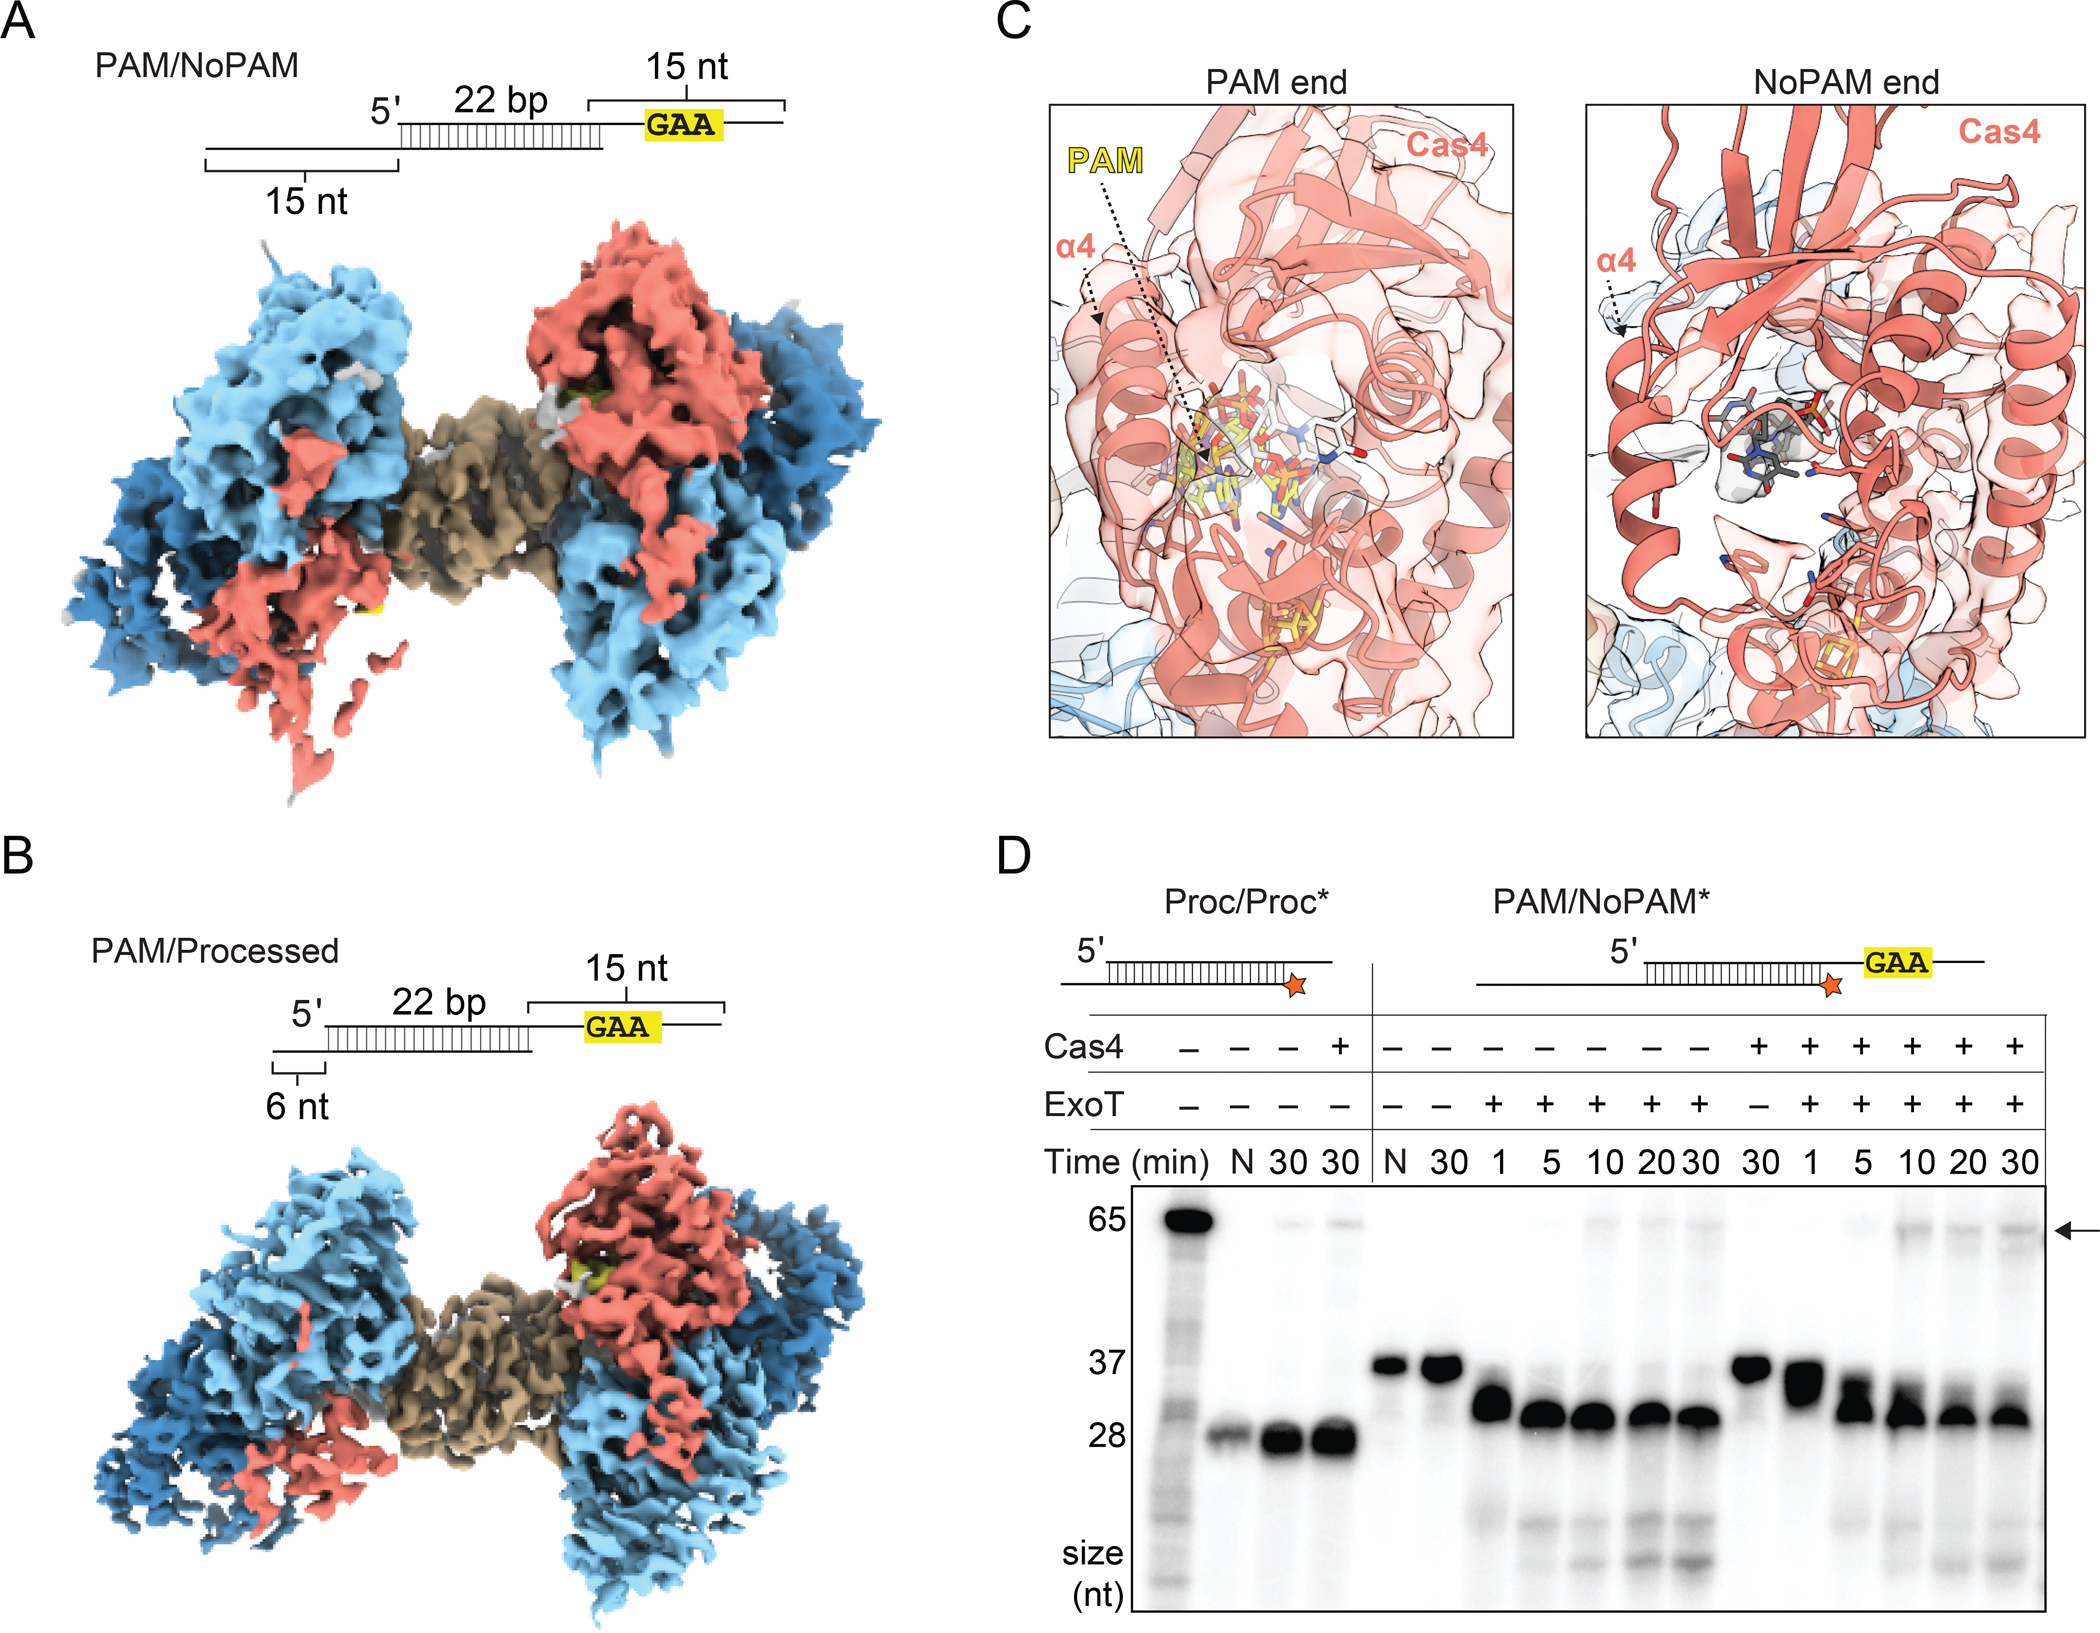
Figure 5, also see Figure S1, S6, S7 and S8: Cas4 slows down exonucleolytic trimming of the non-PAM end.

(A) Substrate schematic and cryo-EM reconstruction of Cas4-Cas1-Cas2 PAM/NoPAM complex.
(B) Substrate schematic and cryo-EM reconstruction of Cas4-Cas1-Cas2 PAM/processed complex.
(C) Densities for Cas4 at PAM and No-PAM ends of PAM/NoPAM complex shown in (A). PAM is colored in yellow and labeled.
(D) Denaturing polyacrylamide gel of the prespacer trimming and integration assays using ExoT exonuclease. The assay was performed with final concentrations of 100 nM Cas1, 50 nM Cas2 and 50 nM Cas4. The first lane contains a radiolabeled 65 nt ssDNA representative of leader site integration product (also see Figure S8C). Lengths of the 65 nt integration product and the Proc/Proc (28 nt) or PAM/NoPAM (37 nt) substrates are indicated on the left of the gel. Lanes with only substrate are labeled N. All other lanes have Cas1 and Cas2. Presence or absence of Cas4 and ExoT is indicated. Black arrow indicates integration products. Note that 32P signal is decreased in the second lane due to a loading error.
