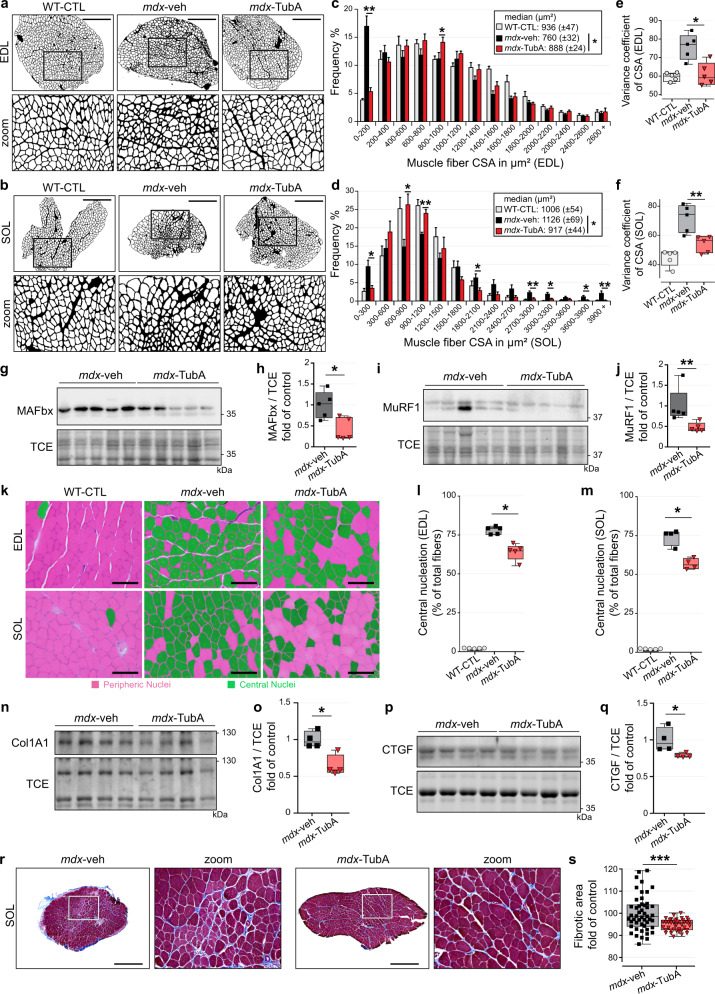
Fig. 2. TubA treatment improves and restores DMD phenotype in mdx muscle and protects from atrophy.
Cross-section areas (CSA) of entire EDL (a) and SOL (b) muscles from 11-wk-old C57BL/10 mice (WT-CTL) and C57BL/10ScSn-Dmdmdx/J mice treated with vehicle-DMSO (mdx-veh) or with TubA (mdx-TubA) for 30 consecutive days were stained using laminin staining and then binarized on ImageJ (n = 5 mice per group). Scale bars: 500 μm. Graphical summary of CSA in EDL (c) and SOL (d) muscle (n = 5 mice per group; entire EDL and SOL muscles were counted per mouse). c, d Data are presented as mean values ± SEM. *P < 0.05; **P < 0.01; two-way ANOVA (mdx-TubA versus mdx-veh). Median CSAs of each muscle are displayed above the frequency histograms. Measurements of variance coefficient in EDL (e) and SOL (f) muscle fibers (n = 5 mice per group). To evaluate levels of MAFbx (g, h) and MuRF1 (i, j) in TA muscles, Western blot analysis (g, i) and quantifications (h, j) were performed (n = 5 mice per group). k Representative examples of cross-sections of EDL and SOL muscles were stained using hematoxylin and eosin. Scale bars: 100 µm. Centrally nucleated fibers are colored in green. Percentage of central nucleation in EDL (l) and SOL (m) muscle fibers (n = 4 or 5 mice per group). To evaluate levels of collagen type I alpha 1 (n, o, Col1A1) and connective tissue growth factor (p, q, CTGF) in TA muscles, Western blot analysis (n, p) and quantifications (o, q) were performed (n=4 mice per group). TCE was used as a loading control for all Western blots. To evaluate level of collagen content infiltration, Masson’s trichrome staining (r) and quantification (s) were performed in SOL muscle. Scale bars: 500 µm. Fibrotic area are colored in blue (n = 28–50 fields counted per mouse, 3 mice per group). (e, f, h, j, l, m, o, q, s) Whiskers min to max; the line in the middle of the box is plotted at the median. *P < 0.05; **P < 0.01; ***P < 0.001; n.s, not significant, P > 0.05; Mann–Whitney U test. kDa, relative molecular weight in kiloDalton.

