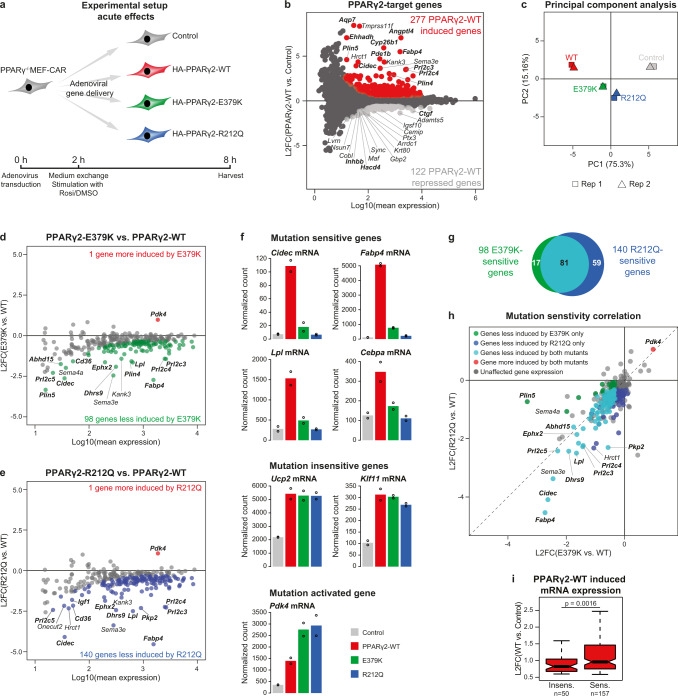
Fig. 5. The E379K and R212Q mutants display partial deregulation of PPARγ-target genes.
a Experimental outline showing the timing of virus transduction, ligand stimulation (1 µM Rosiglitazone) and harvest of PPARγ−/− MEF-CAR cells to investigate acute transcriptional changes upon introduction of WT and mutant PPARγ2s. b Identification of PPARγ2-target genes from RNA-seq data. PPARγ2-WT induced (red dots) and repressed (light gray dots) genes are defined using DESeq2 with Benjamini–Hochberg correction (padj. <0.05, two-sided) and increasing or decreasing by a fold change >1.5 compared to control cells, respectively. Black dots represent unaffected genes. L2FC, log2 fold change. Top-15 most induced and repressed genes are indicated, with genes known to be involved in adipocyte biology marked in bold. c Variance in RNA-seq data (n = 2 independent biological experiments). Identification of d E379K-sensitive and e R212Q-sensitive PPARγ2-target genes. Red dots represent genes more induced by mutant compared to WT PPARγ2 (padj.(mut vs. WT) < 0.05, FC (mut vs. WT) > 1.25). Green and blue dots represent genes less induced by E379K and R212Q compared to WT, respectively (padj.(mut vs. WT) < 0.05, FC (mut vs. WT) < −1.25). Statistical significance was determined by DESeq2 using Benjamini–Hochberg correction, two-sided test. L2FC, log2 fold change. Top-15 less induced genes are indicated. Genes known to be involved in adipocyte biology are marked in bold. f Bar plots indicating RNA-seq based expression of selected PPARγ2-target genes. Bars represents mean of independent biological replicates (n = 2), dots indicate individual replicates. g Venn diagram representing overlap of genes that are significantly downregulated by PPARγ2-E379K and -R212Q. h Correlation of sensitivity to the E379K and R212Q mutations relative to WT (L2FC, log2 fold change). Top-10 most affected genes for each mutant vs. WT is indicated. i Boxplot displaying induction levels for genes affected by one or both mutations (sens., n = 157) or genes changing less than 25% (mutant vs. WT) (insens., n = 50). L2FC, log2 fold change. Data are presented as notch, median; box, first and third quartiles; whiskers, 1.5 times the interquartile range. Statistical significance was determined by two-sided unpaired two-samples Wilcoxon–Mann–Whitney test. Source data for panel b–i are provided in the Source Data file.

