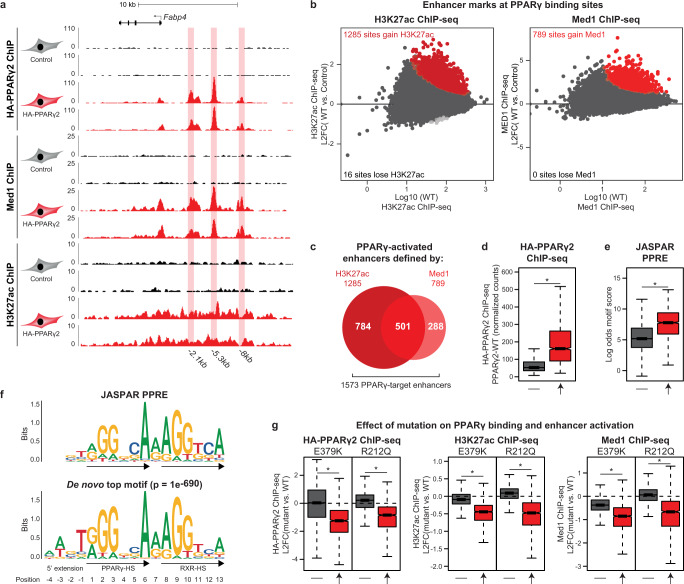
Fig. 6. A subset of PPARγ-bound sites are functional PPARγ-target enhancers.
a UCSC Genome Browser screenshot showing HA-PPARγ, Med1, and H3K27ac ChIP-seq in control and PPARγ2-WT expressing cells at the Fabp4-locus. PPARγ-binding sites (identified using Homer findPeaks and extended to 500 bp and passing a cutoff of <35 tags) are highlighted. Annotation of PPARγ-binding sites are relative to the transcriptional start site (TSS) of Fabp4. b Identification of enhancers activated by PPARγ2-WT. H3K27ac and Med1 ChIP-seq signal was counted within 41830 PPARγ binding sites extended ±1500 bp (H3K27ac) or ±250 bp (Med1) from peak center. Red and light gray points indicate enhancers that gain or lose ChIP-seq signal, respectively, upon PPARγ2-WT expression. Significance was determined by DESeq2 with Benjamini–Hochberg correction, two-sided test(FDR < 0.1). L2FC, log2 fold change. c Venn diagram showing the number of activated enhancers defined by gain in H3K27ac and/or Med1 ChIP-seq signal, in total identifying 1573 PPARγ-target enhancers. d Boxplot of PPARγ ChIP-seq signal in enhancers that does not gain or lose enhancer activity upon PPARγ2-WT expression (−, n = 40241), or at PPARγ-target enhancers as defined in panel b, c (↑, n = 1573). e JASPAR PPRE-motif score of the highest scoring motif within ±100bp from peak center. −: Non-activated enhancers, ↑: PPARγ-target enhancers. f Position weight matrix (PWM) for the JASPAR PPRE (top) and the de novo top motif (bottom). De novo motif search was made using Homer findMotifsGenome and searched within ±100 bp of peak center of PPARγ-target enhancers with motif length of 15–17 bases. PPAR-HS PPAR-half site, RXR-HS RXR-half site. g Mutations affect primarily PPARγ-target enhancers. Boxplots showing the log2 fold change (L2FC) (mutant vs. WT) for HA-PPARγ, H3K27ac, and Med1 ChIP-seq signal in non-activated (−) and activated (↑) enhancers. For all boxplots, data are presented as notch, median; box, first and third quartiles; whiskers, 1.5 times the interquartile range. *p < 2e-16 using two-sided unpaired two-samples Wilcoxon–Mann–Whitney test. Source data for panel b, and d–g are provided in the Source Data file.

