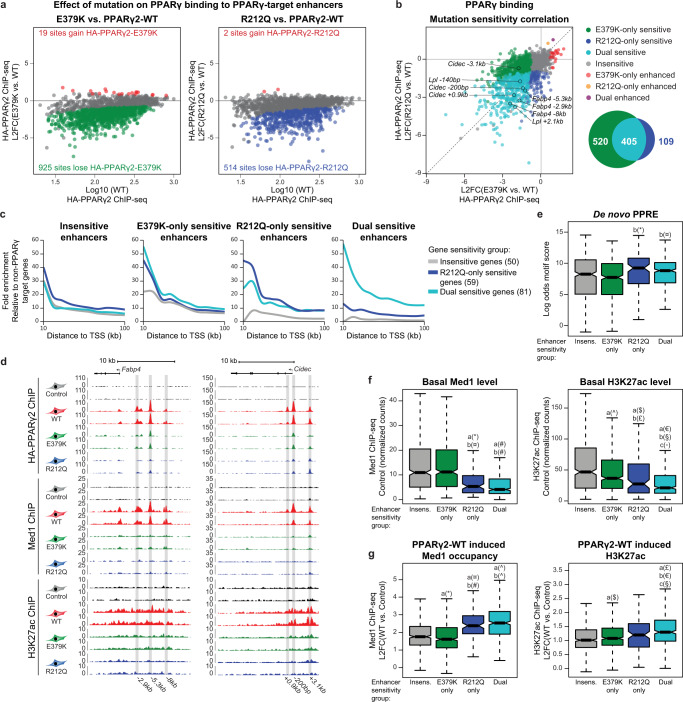
Fig. 7. PPARγ target enhancers display different sensitivity to mutations dependent on basal enhancer activity.
a MA-plots of PPARγ2-E379K (left) and PPARγ2-R212Q (right) binding relative to PPARγ2-WT binding (L2FC, log2 fold change). Gained and lost binding is defined by padj. (mut vs. WT) < 0.05 (DESeq2 with Benjamini–Hochberg correction, two-sided) and the binding intensity (mut vs. WT) increasing or decreasing by at least 25%, respectively. b Correlation of sensitivity to E379K mutation and R212Q mutation (left) (L2FC, log2 fold change). Selected enhancers are indicated. Venn-diagram of enhancers with mutation-facilitated reduced PPARγ-binding (right). c Enrichment of enhancers in the vicinity of PPARγ-target genes relative to the number of enhancers in the vicinity of 200 randomly selected genes not regulated by PPARγ. R212Q-only and dual-sensitive genes are defined as in Fig. 5h. Insensitive target genes are changing less than 25% comparing mutant vs. WT PPARγ. E379K-only sensitive genes are excluded from the analysis as the gene group is very small (17 genes). (TSS, transcriptional start site). d UCSC Genome Browser track showing HA-PPARγ, Med1, and H3K27ac ChIP-seq at the Fabp4-locus (left) and Cidec- locus (right). PPARγ-target enhancers are highlighted. e Boxplot of log odds motif score for the de novo PPRE within groups of enhancers. Significance was assessed by two-sided pairwise Wilcoxon rank sum tests with Benjamini–Hochberg correction, a, versus insensitive enhancer group (insens., n = 519); b, versus E379K-only sensitive enhancer group (n = 520); c, versus R212Q-only sensitive enhancer group (n = 109); dual-sensitive group (n = 405), *p = 0.0005, ¤p = 5.7e-5. f Boxplot of basal Med1 (left) and H3K27ac (right) ChIP-seq signal within enhancer groups. Significance was assessed as in panel e. *p = 4.8e-10, ¤p = 3.3e-10, #p < 2e-16, ^p = 0.0030, $p = 0.00062, £p = 0.024, €p < 2e-16, §p = 2.4e-14, ◦p = 0.046. g Boxplot of PPARγ2-WT induced changes in Med1 and H3K27ac ChIP-seq signal within enhancer groups (L2FC, log2 fold change). Significance was assessed as in panel e. *p = 0.0037, ¤p = 1.4e-11, #p = 4.3e-16, ^p < 2e-16, $p = 0.024, £p = 9.4e-12, €p = 1.1e-7, §p = 0.049. Data in boxplots are presented as notch, median; box, first and third quartiles; whiskers, 1.5 times the interquartile range. Source data for panel a–c and e–f are provided as a Source Data file.

